Interpret evaluation results
Once you submit the experiments, you can view them in the UI in the Project > Experiments Tab.
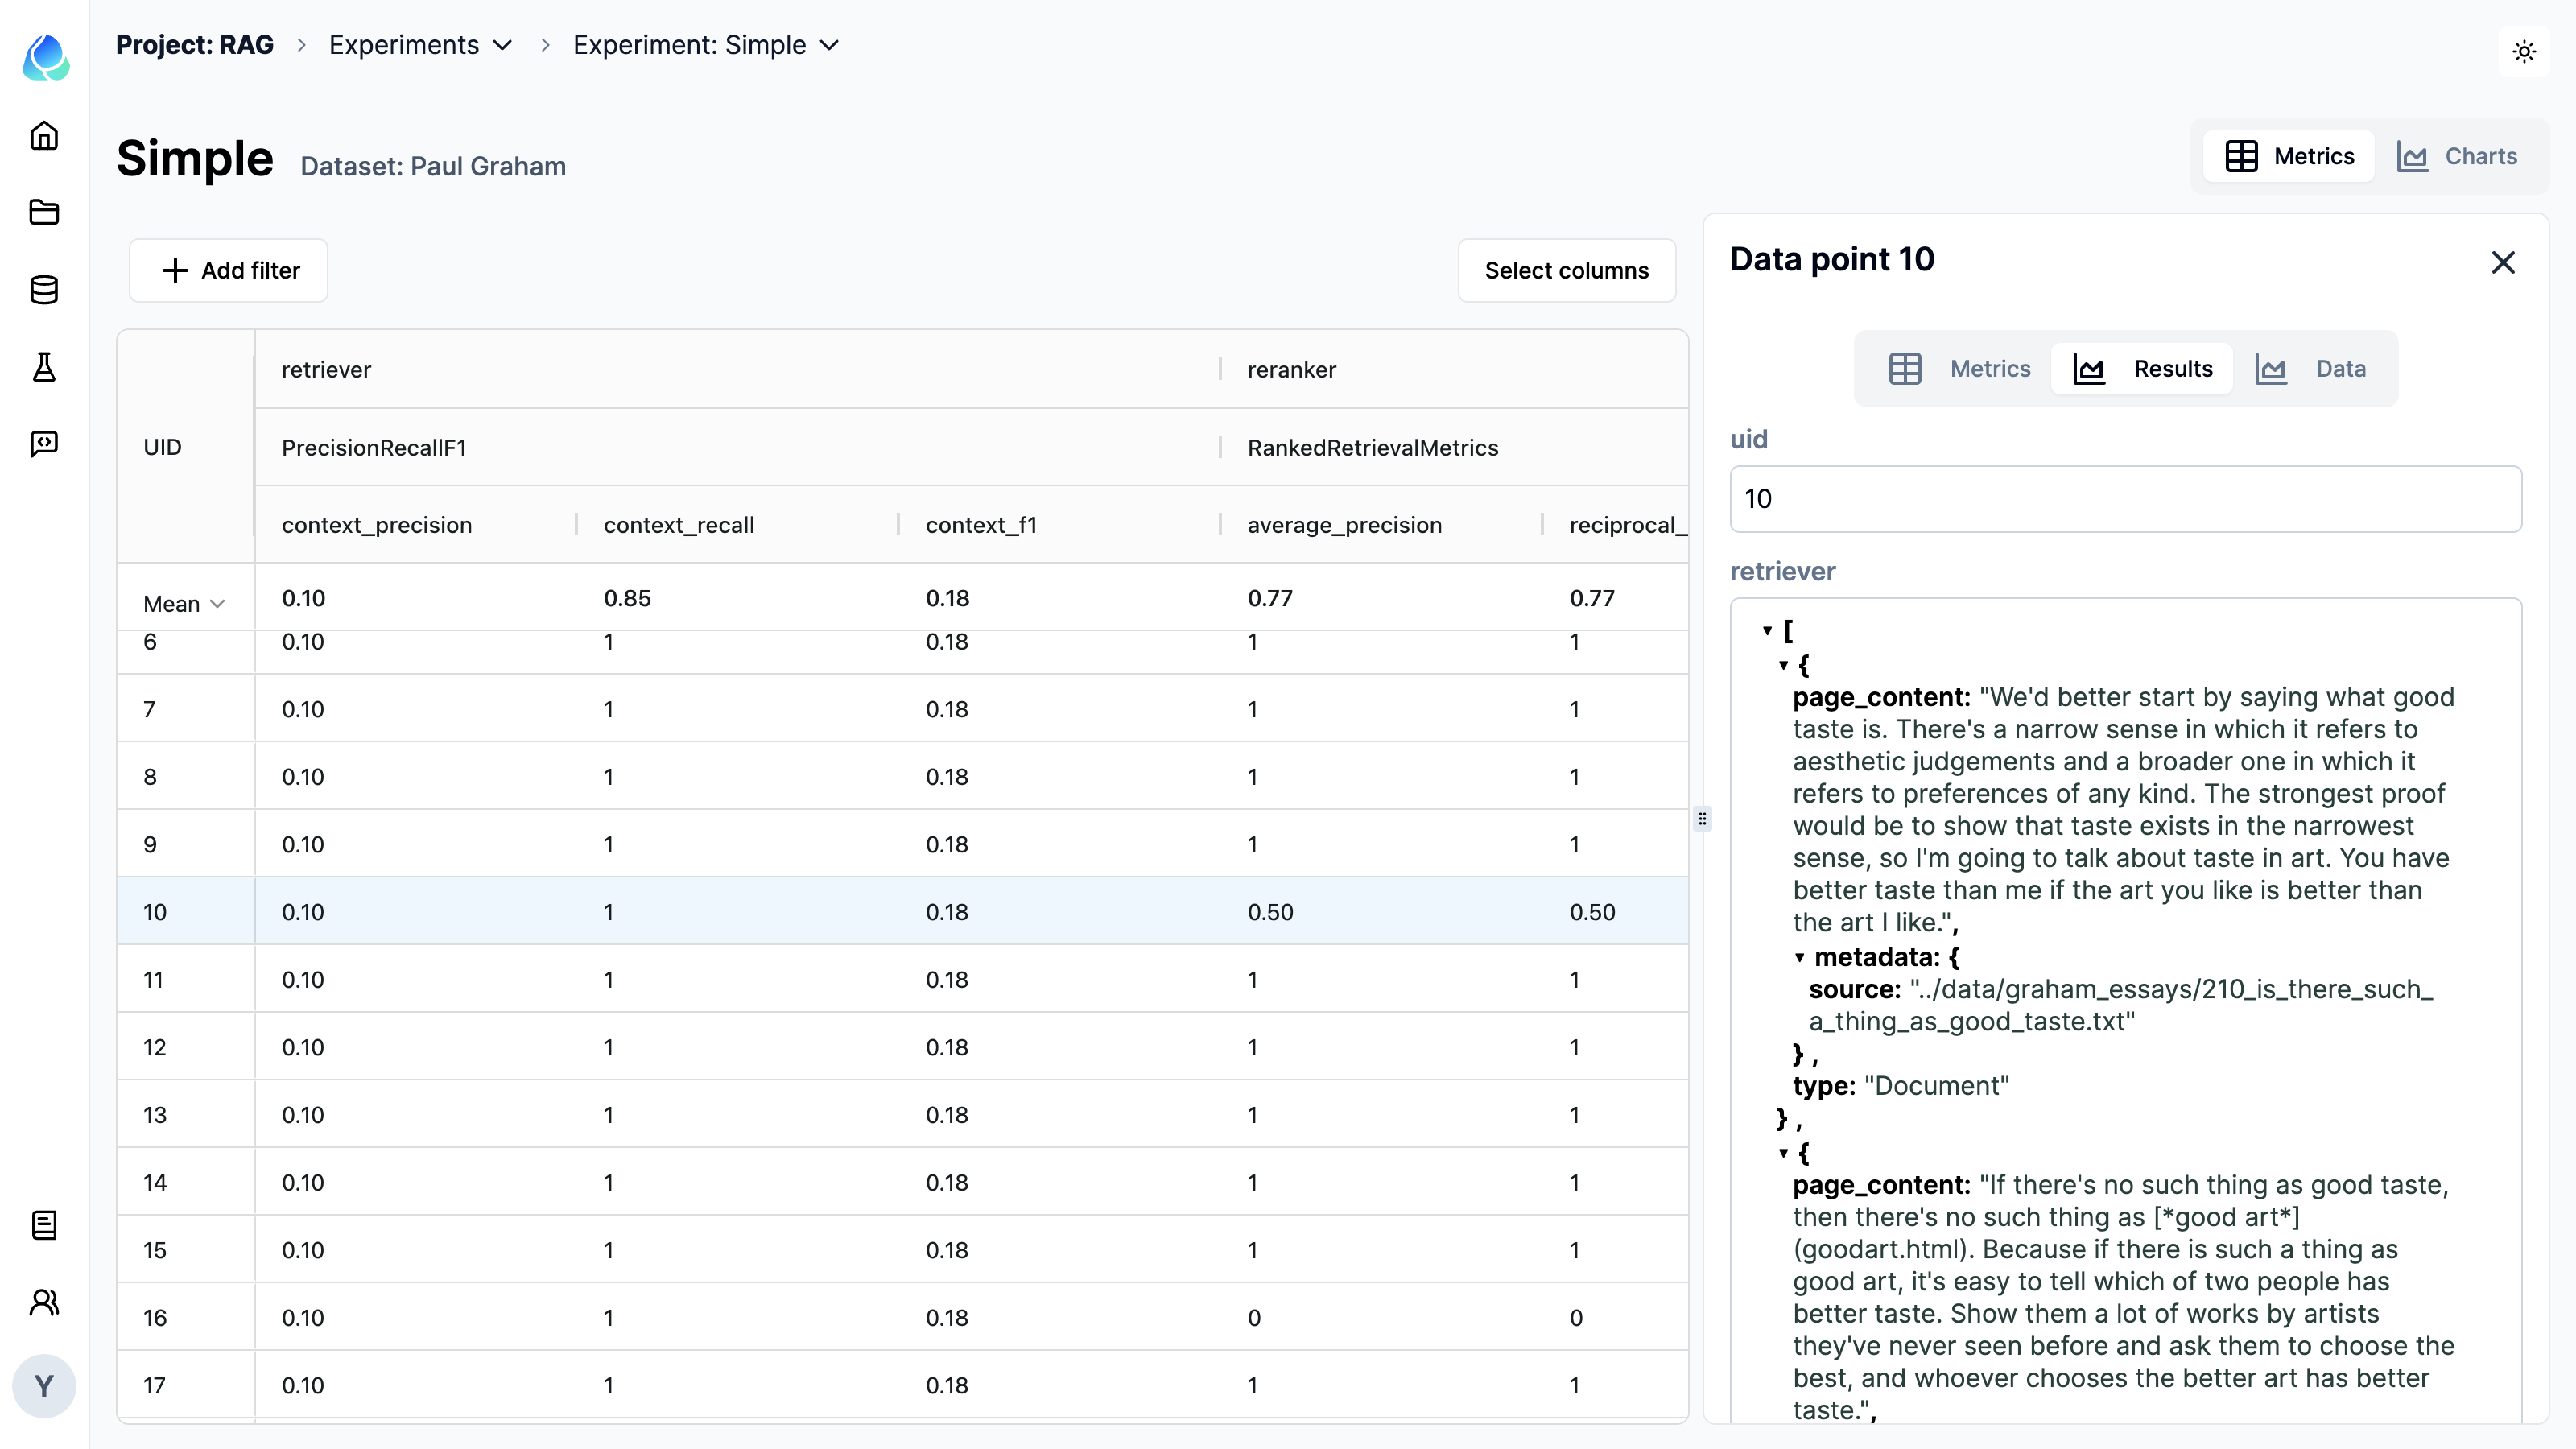
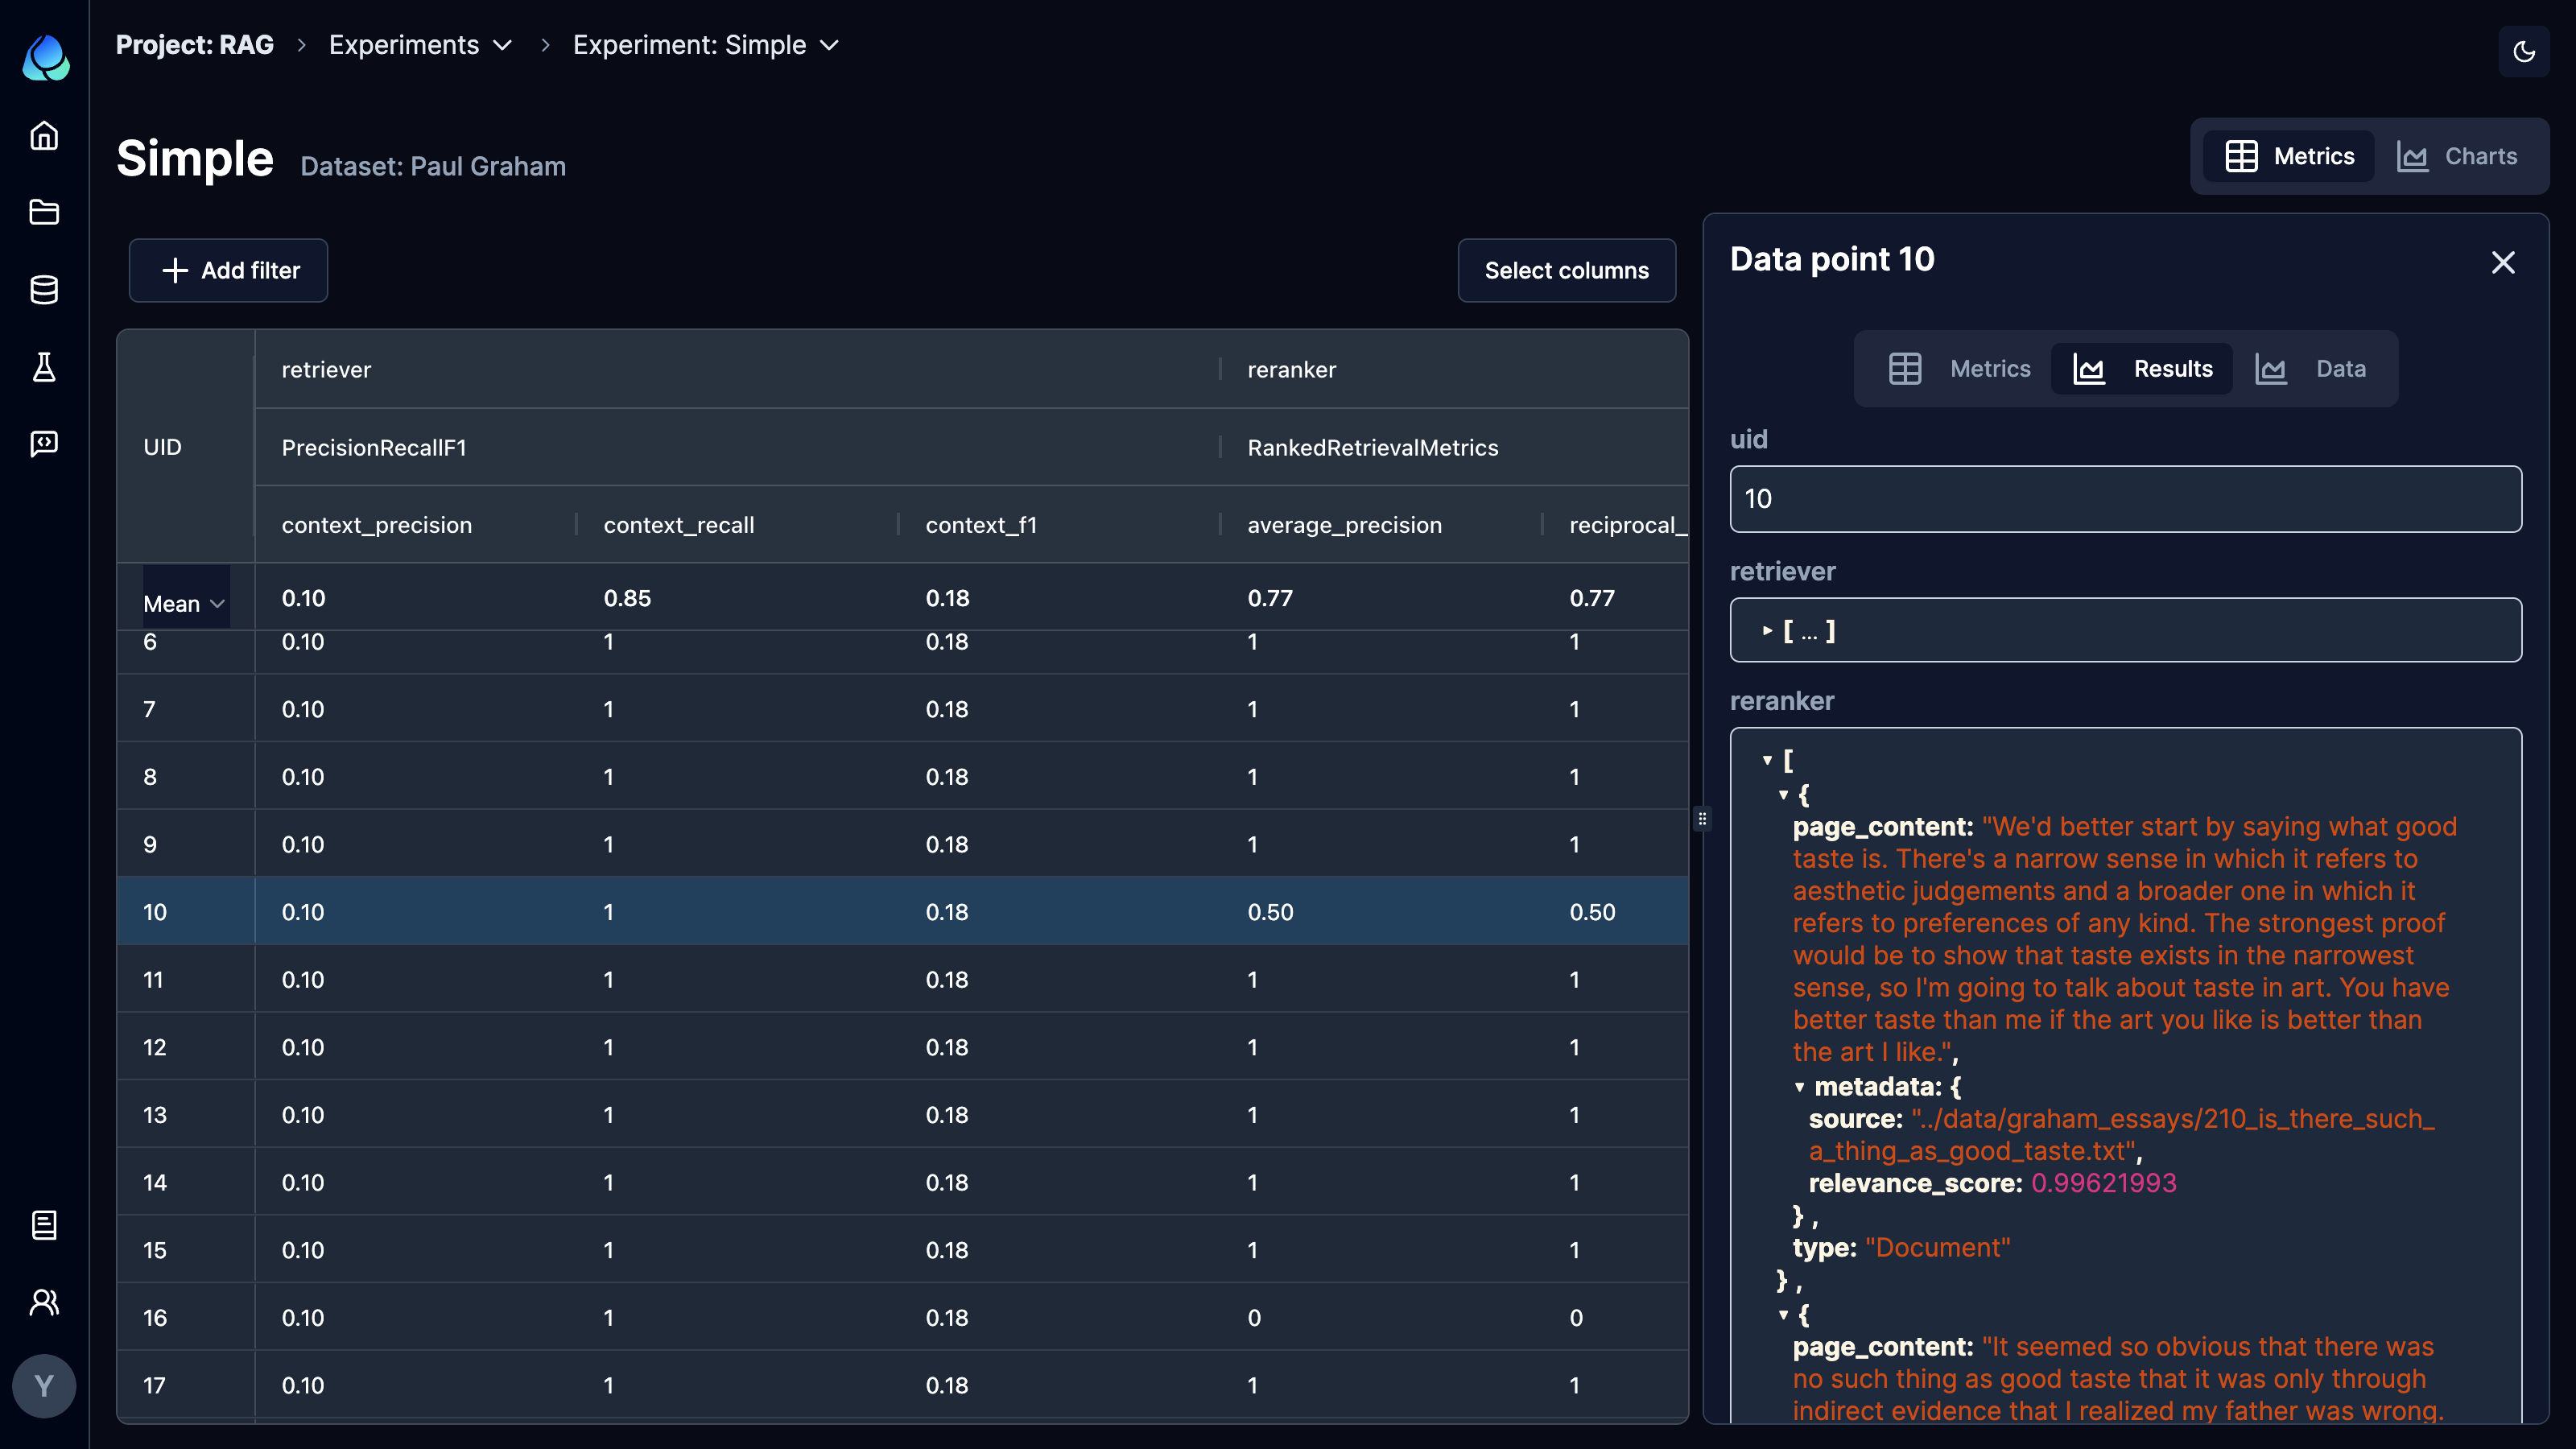
Inspect individual data points
To get a detailed view of the metric scores for each data point, you can check the sidebar which provides a comprehensive breakdown.
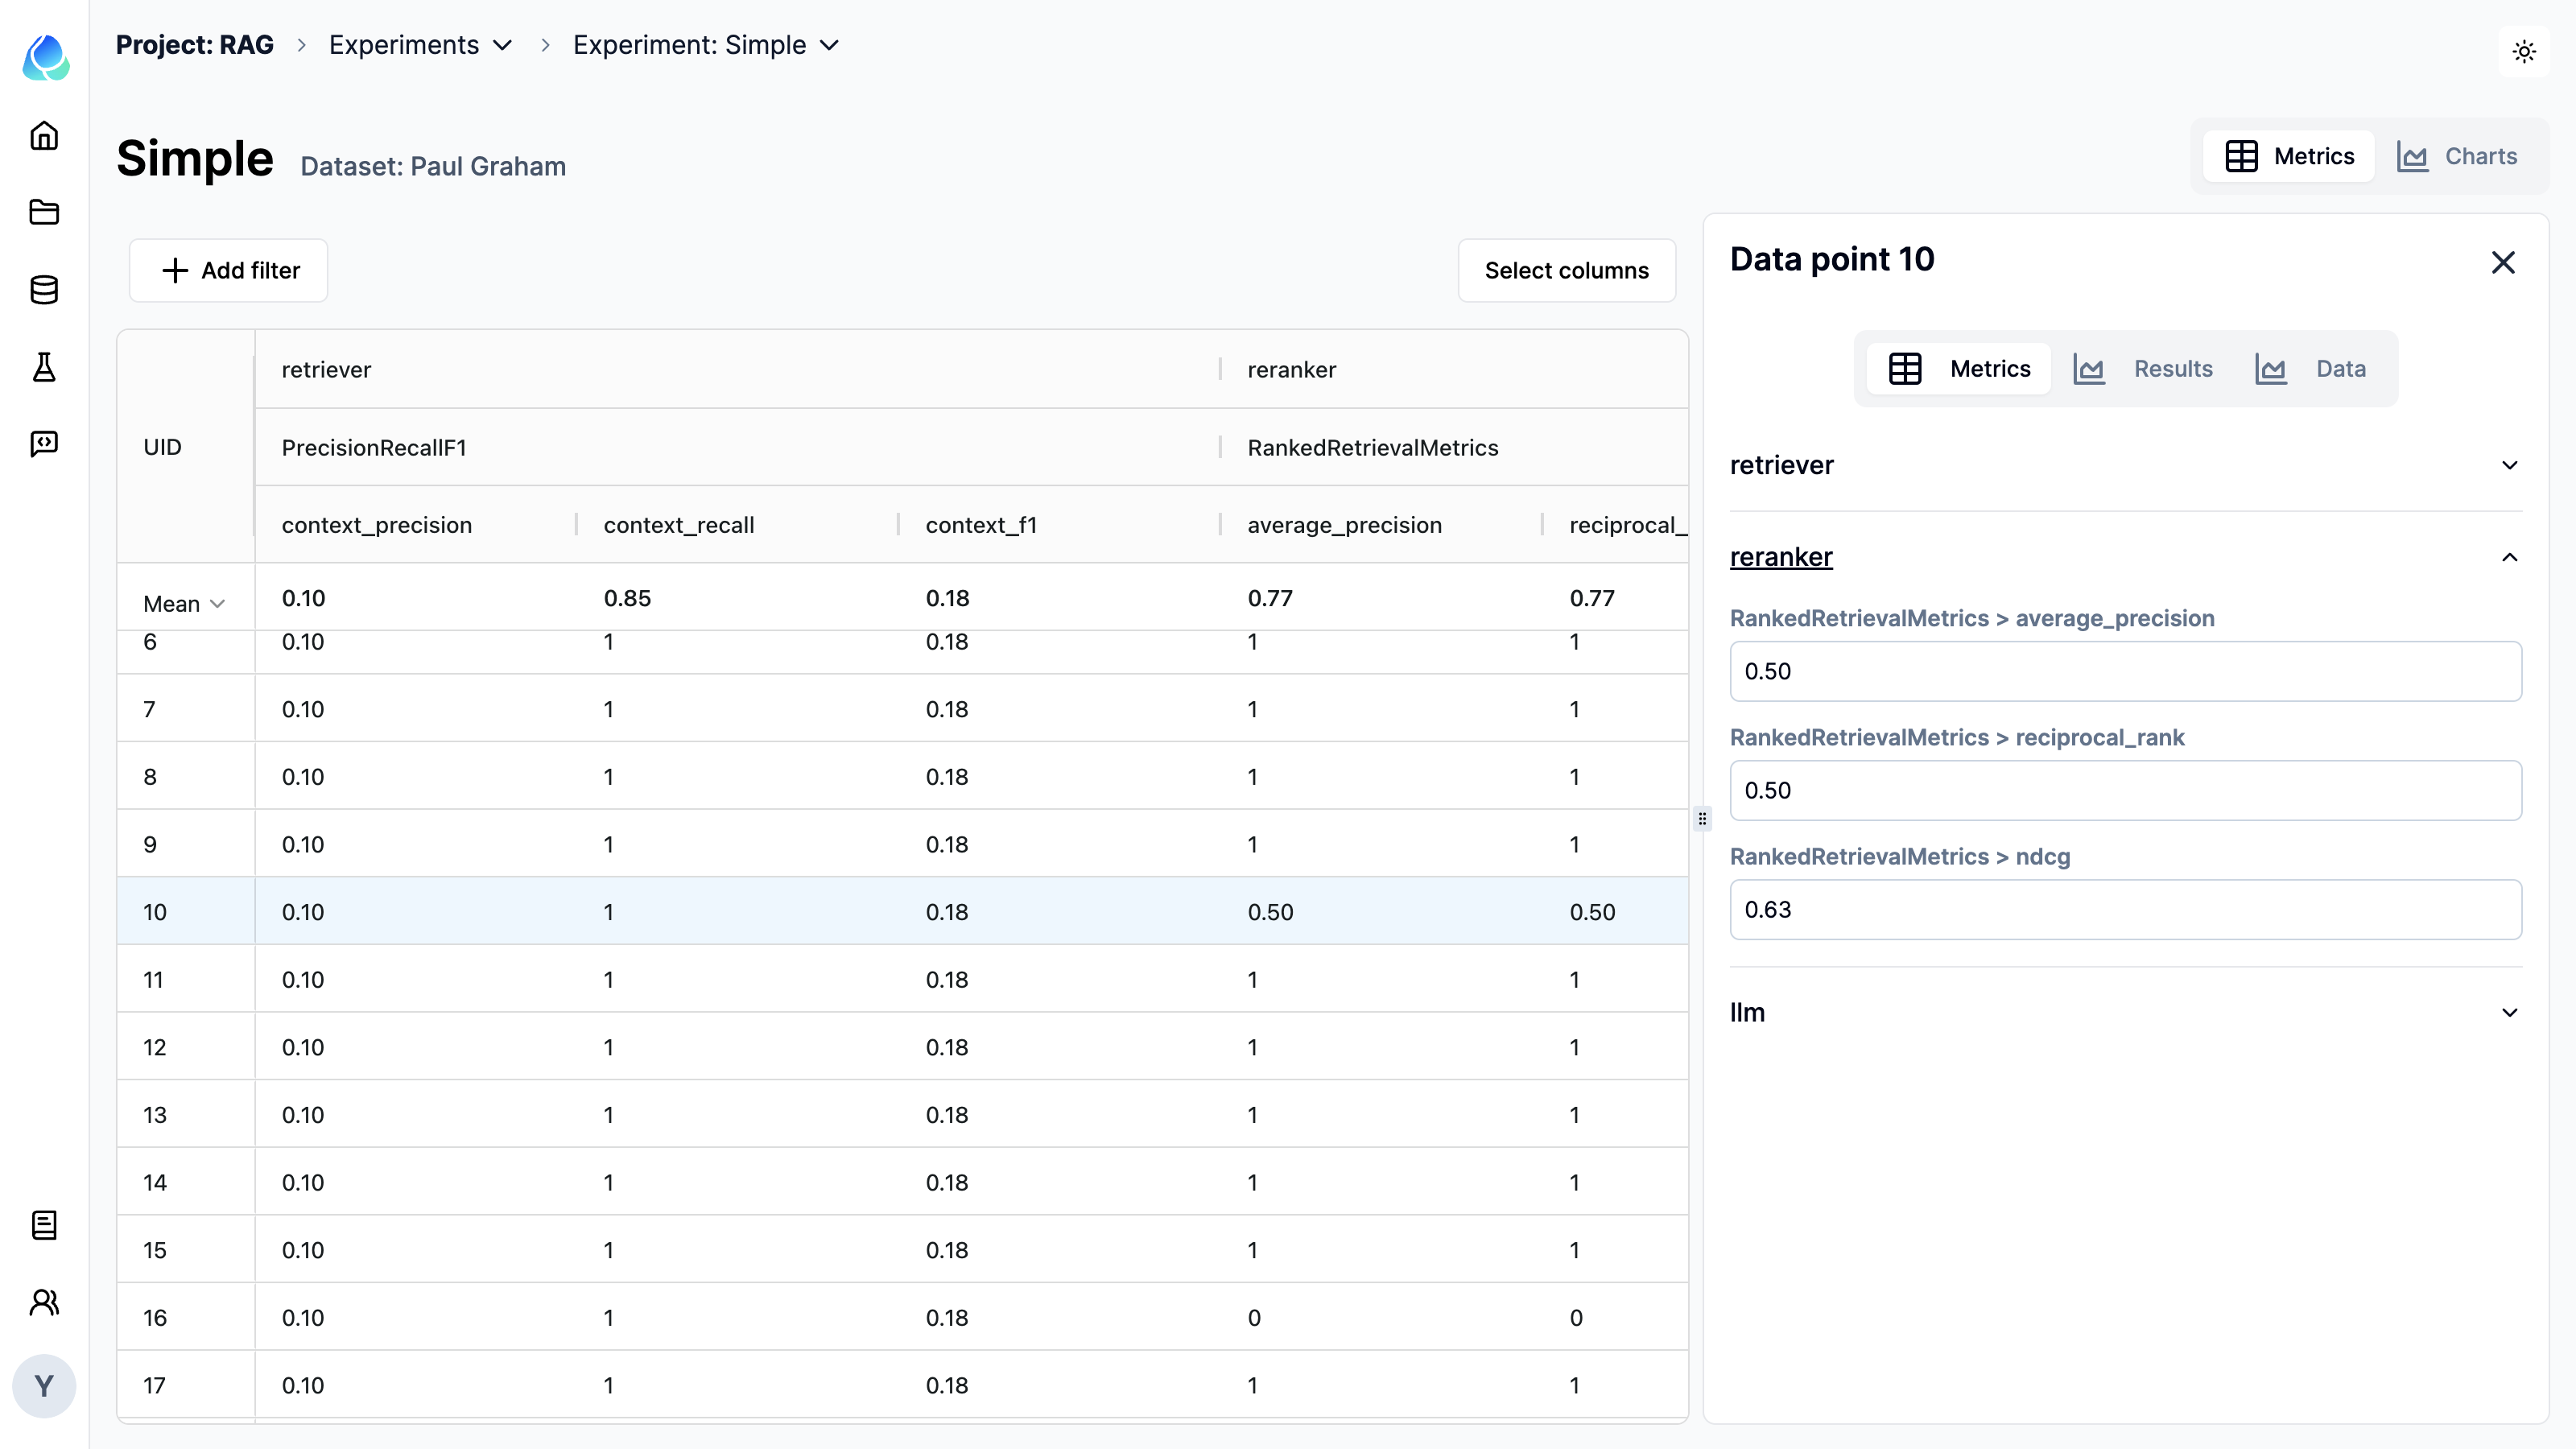
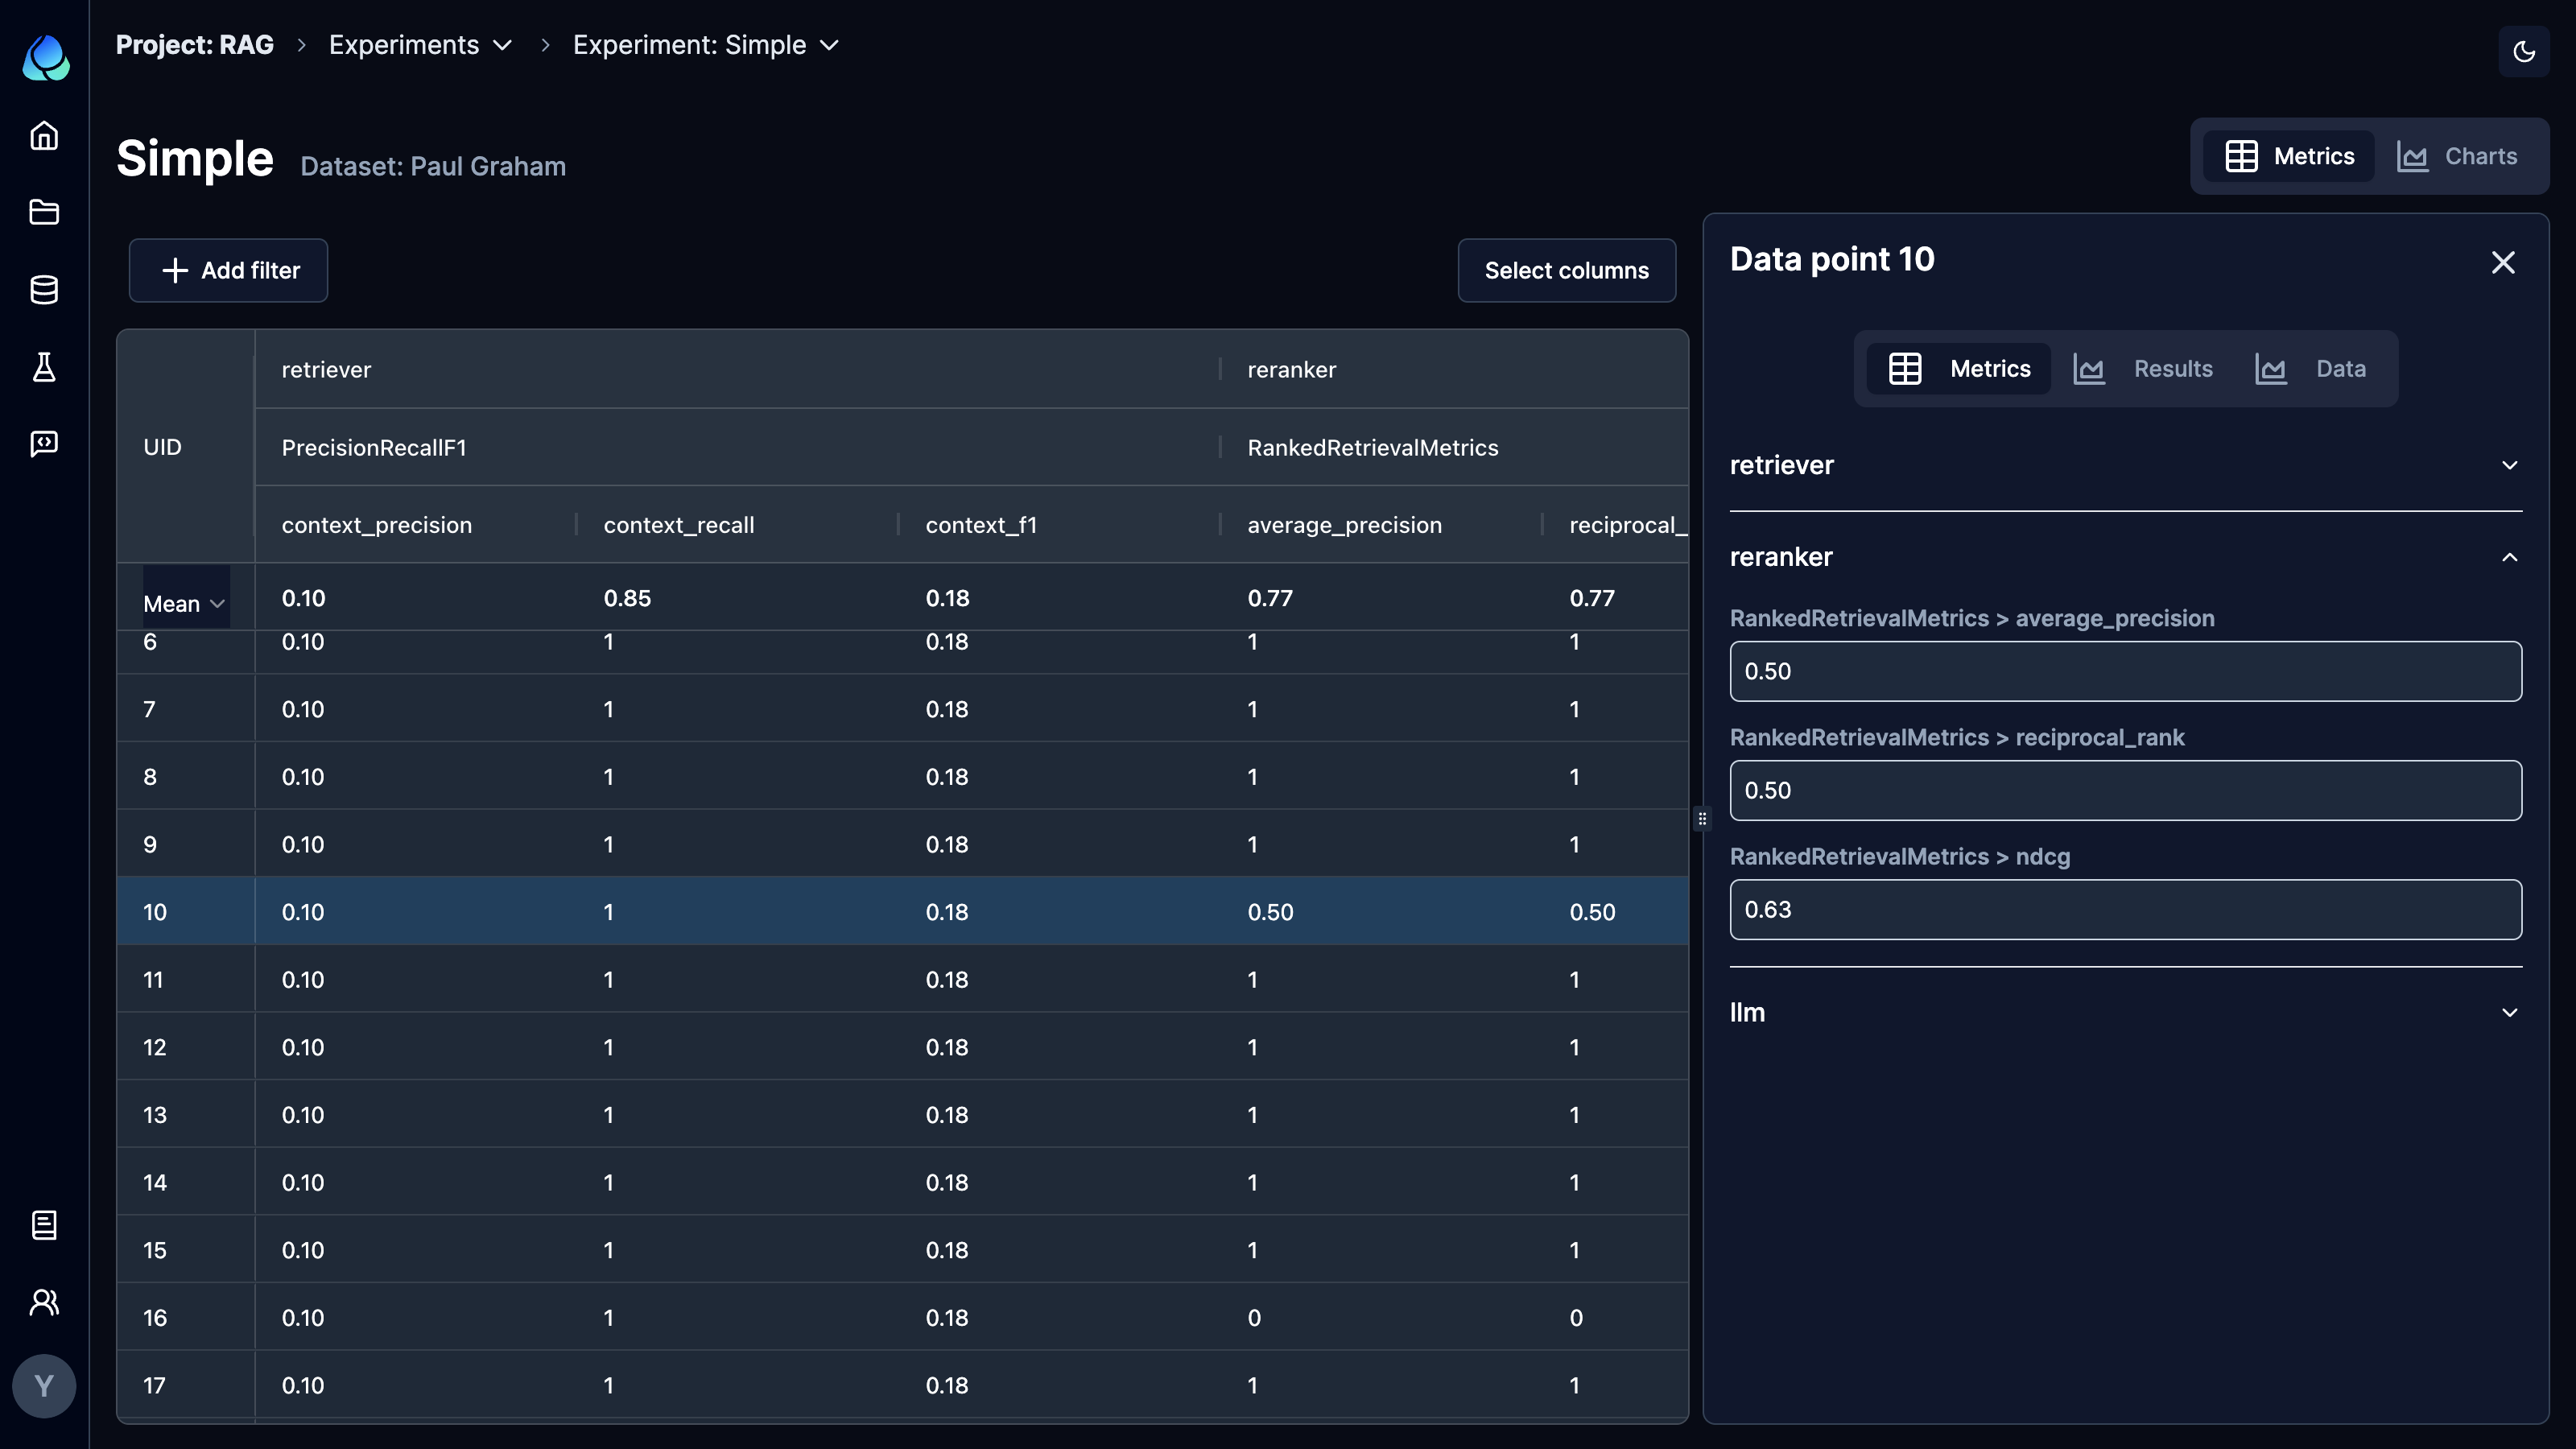
Many metrics contain reasoning in addition to scores. Leverage reasoning to understand why a module performed well or poorly.
For more granular insights, you can inspect specific sample outputs directly from the sidebar.
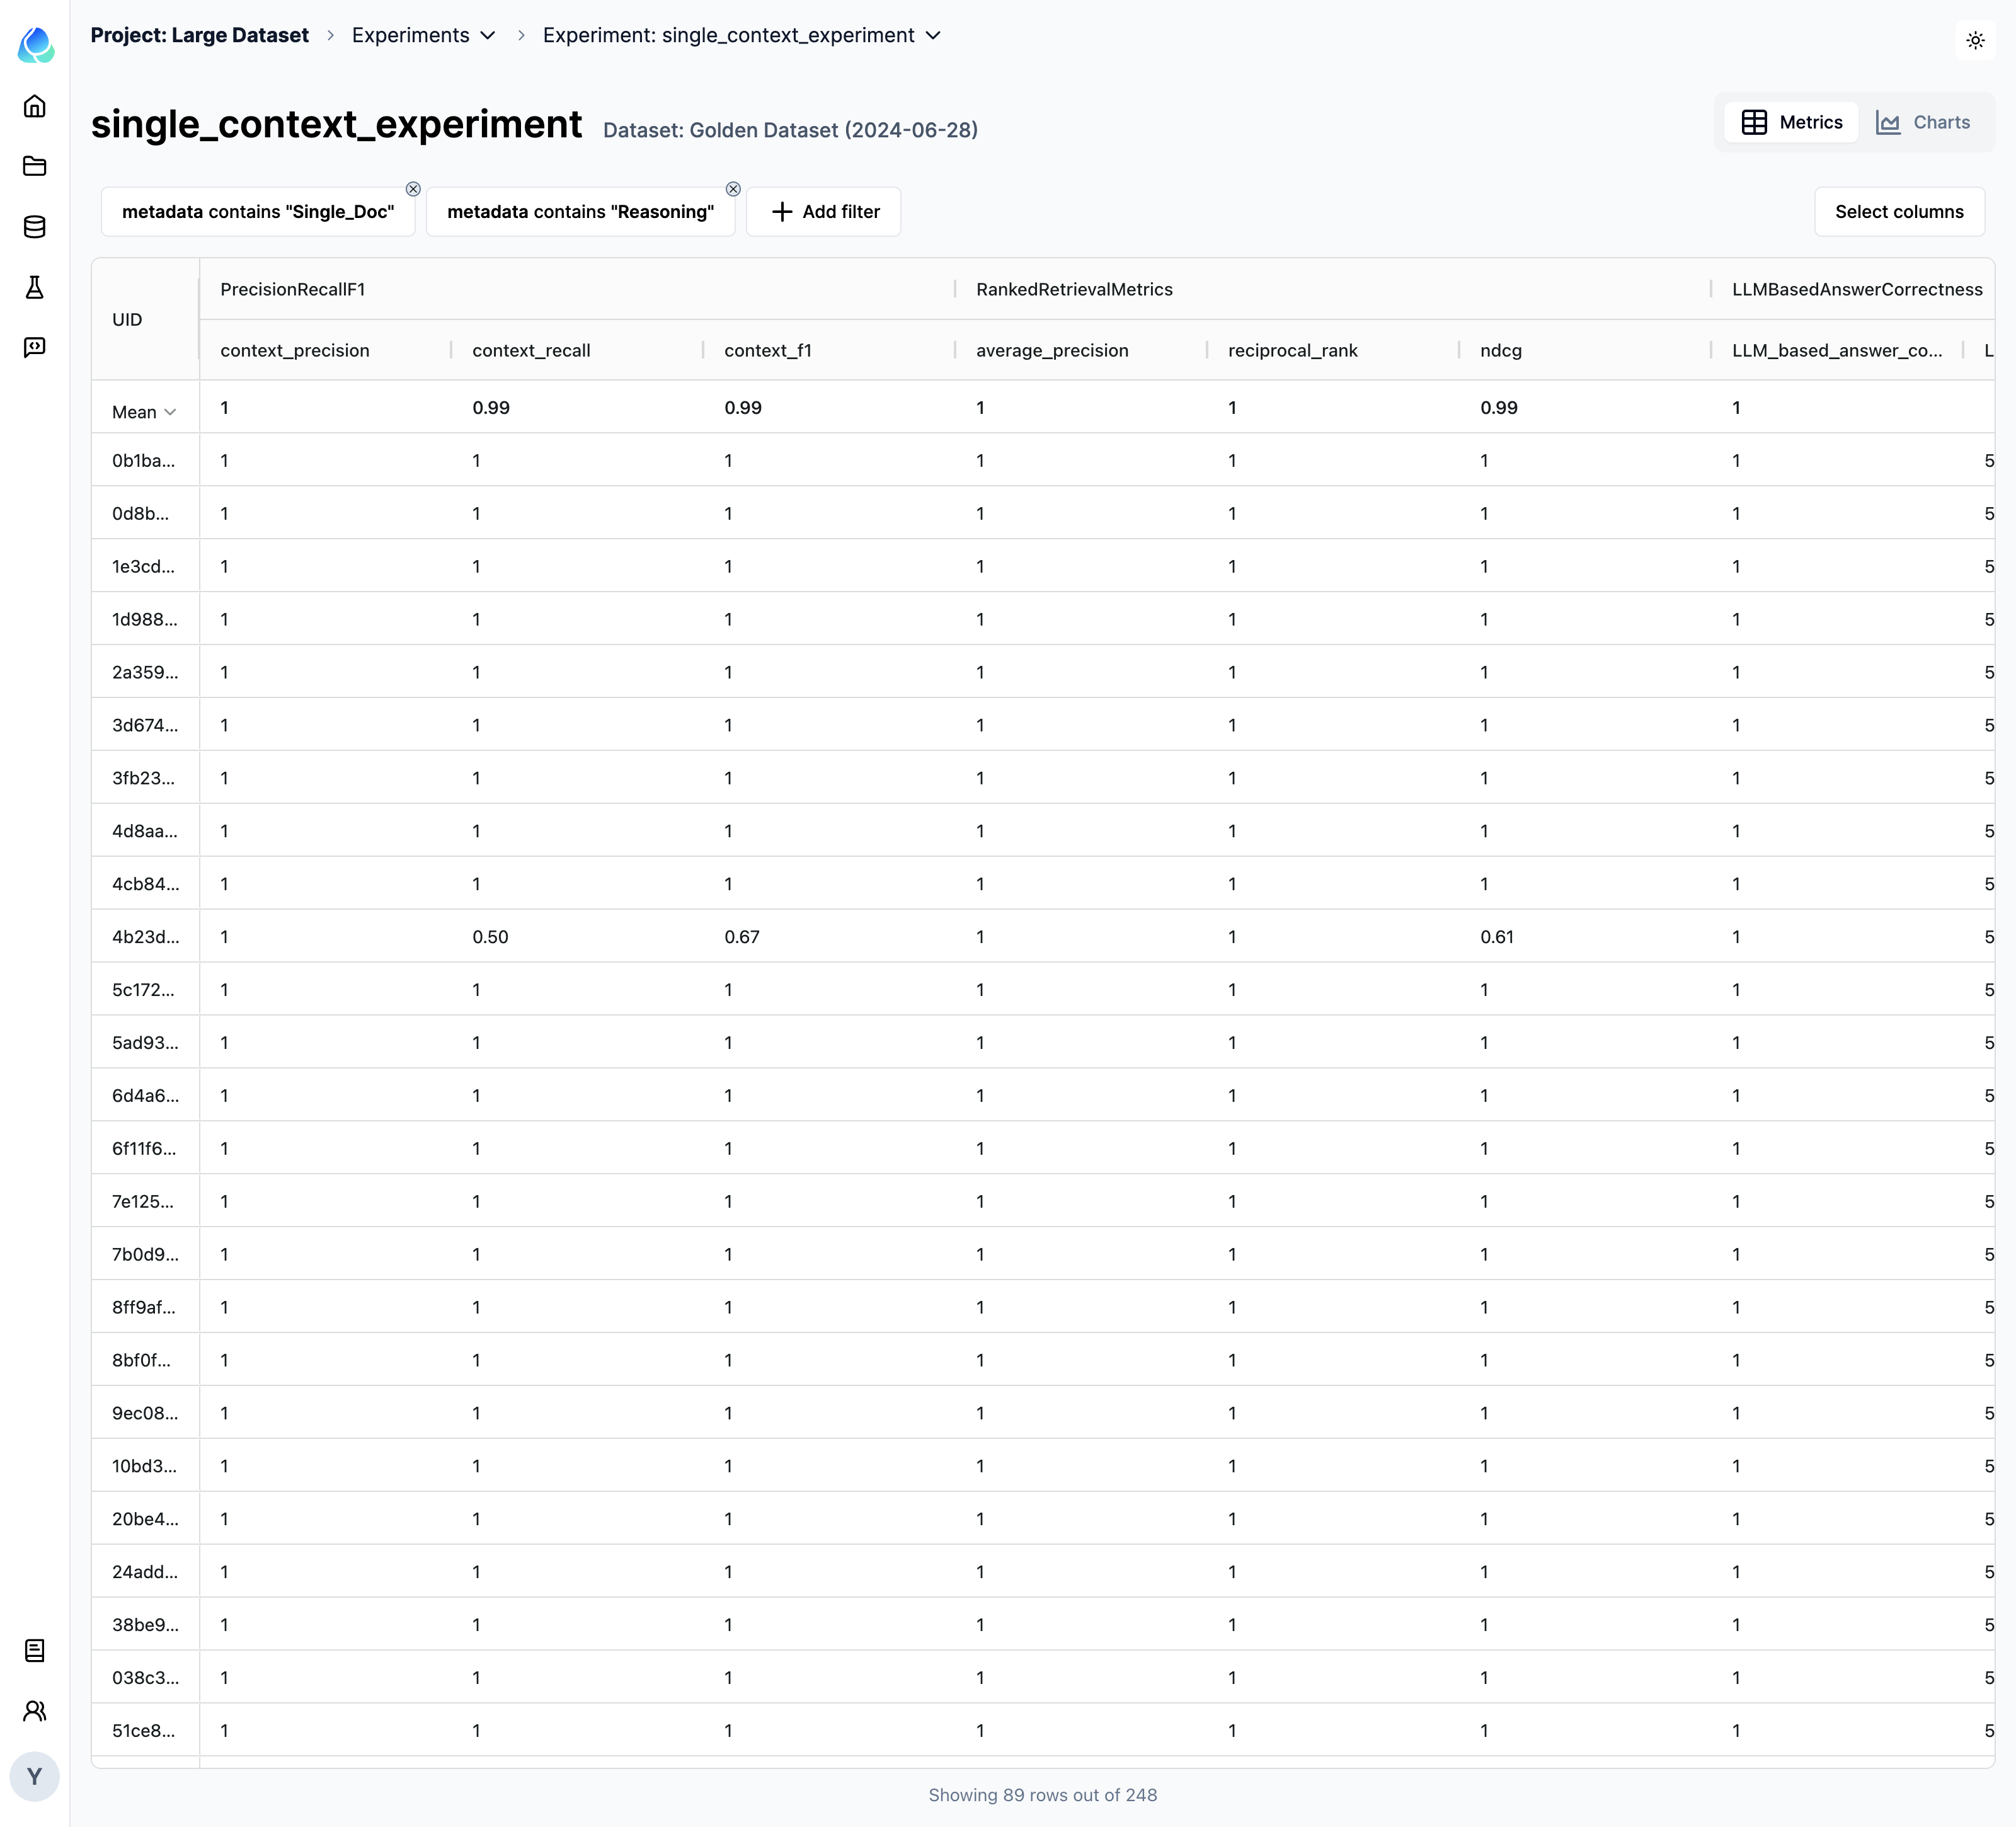
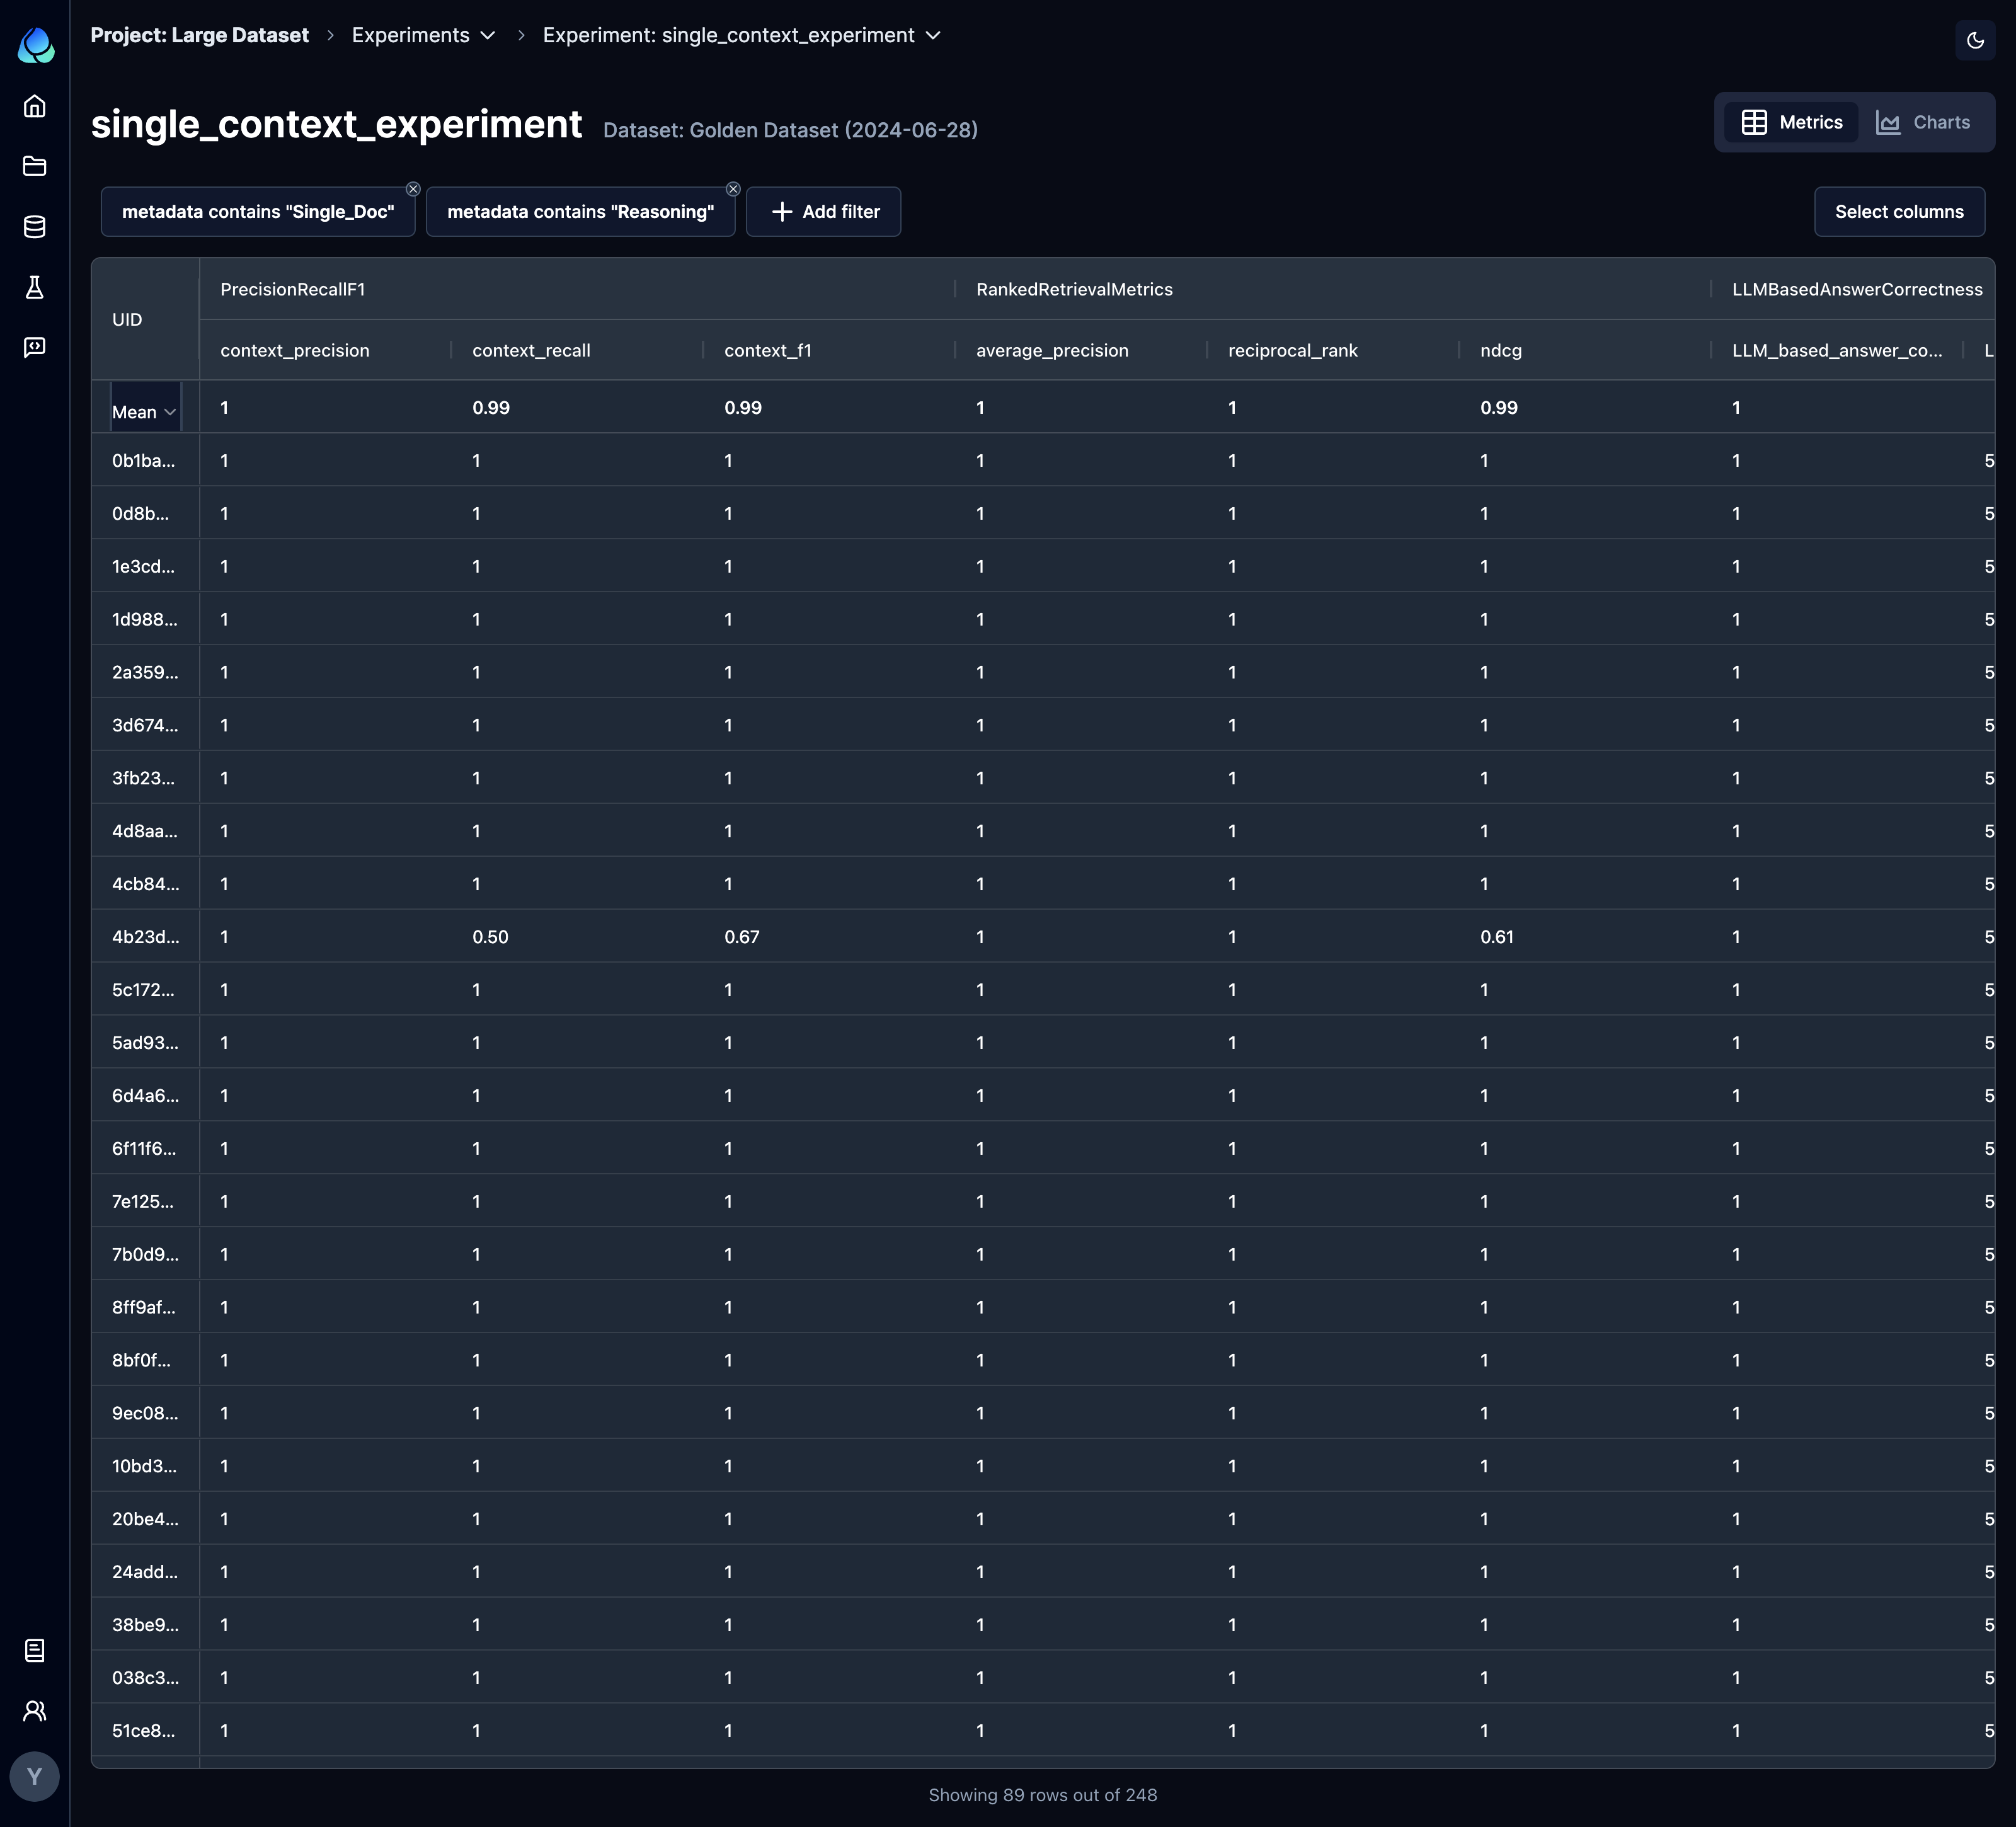
Sorting and filtering
You have the option to sort and filter experiments by various metadata, keywords, and metrics to streamline your analysis.
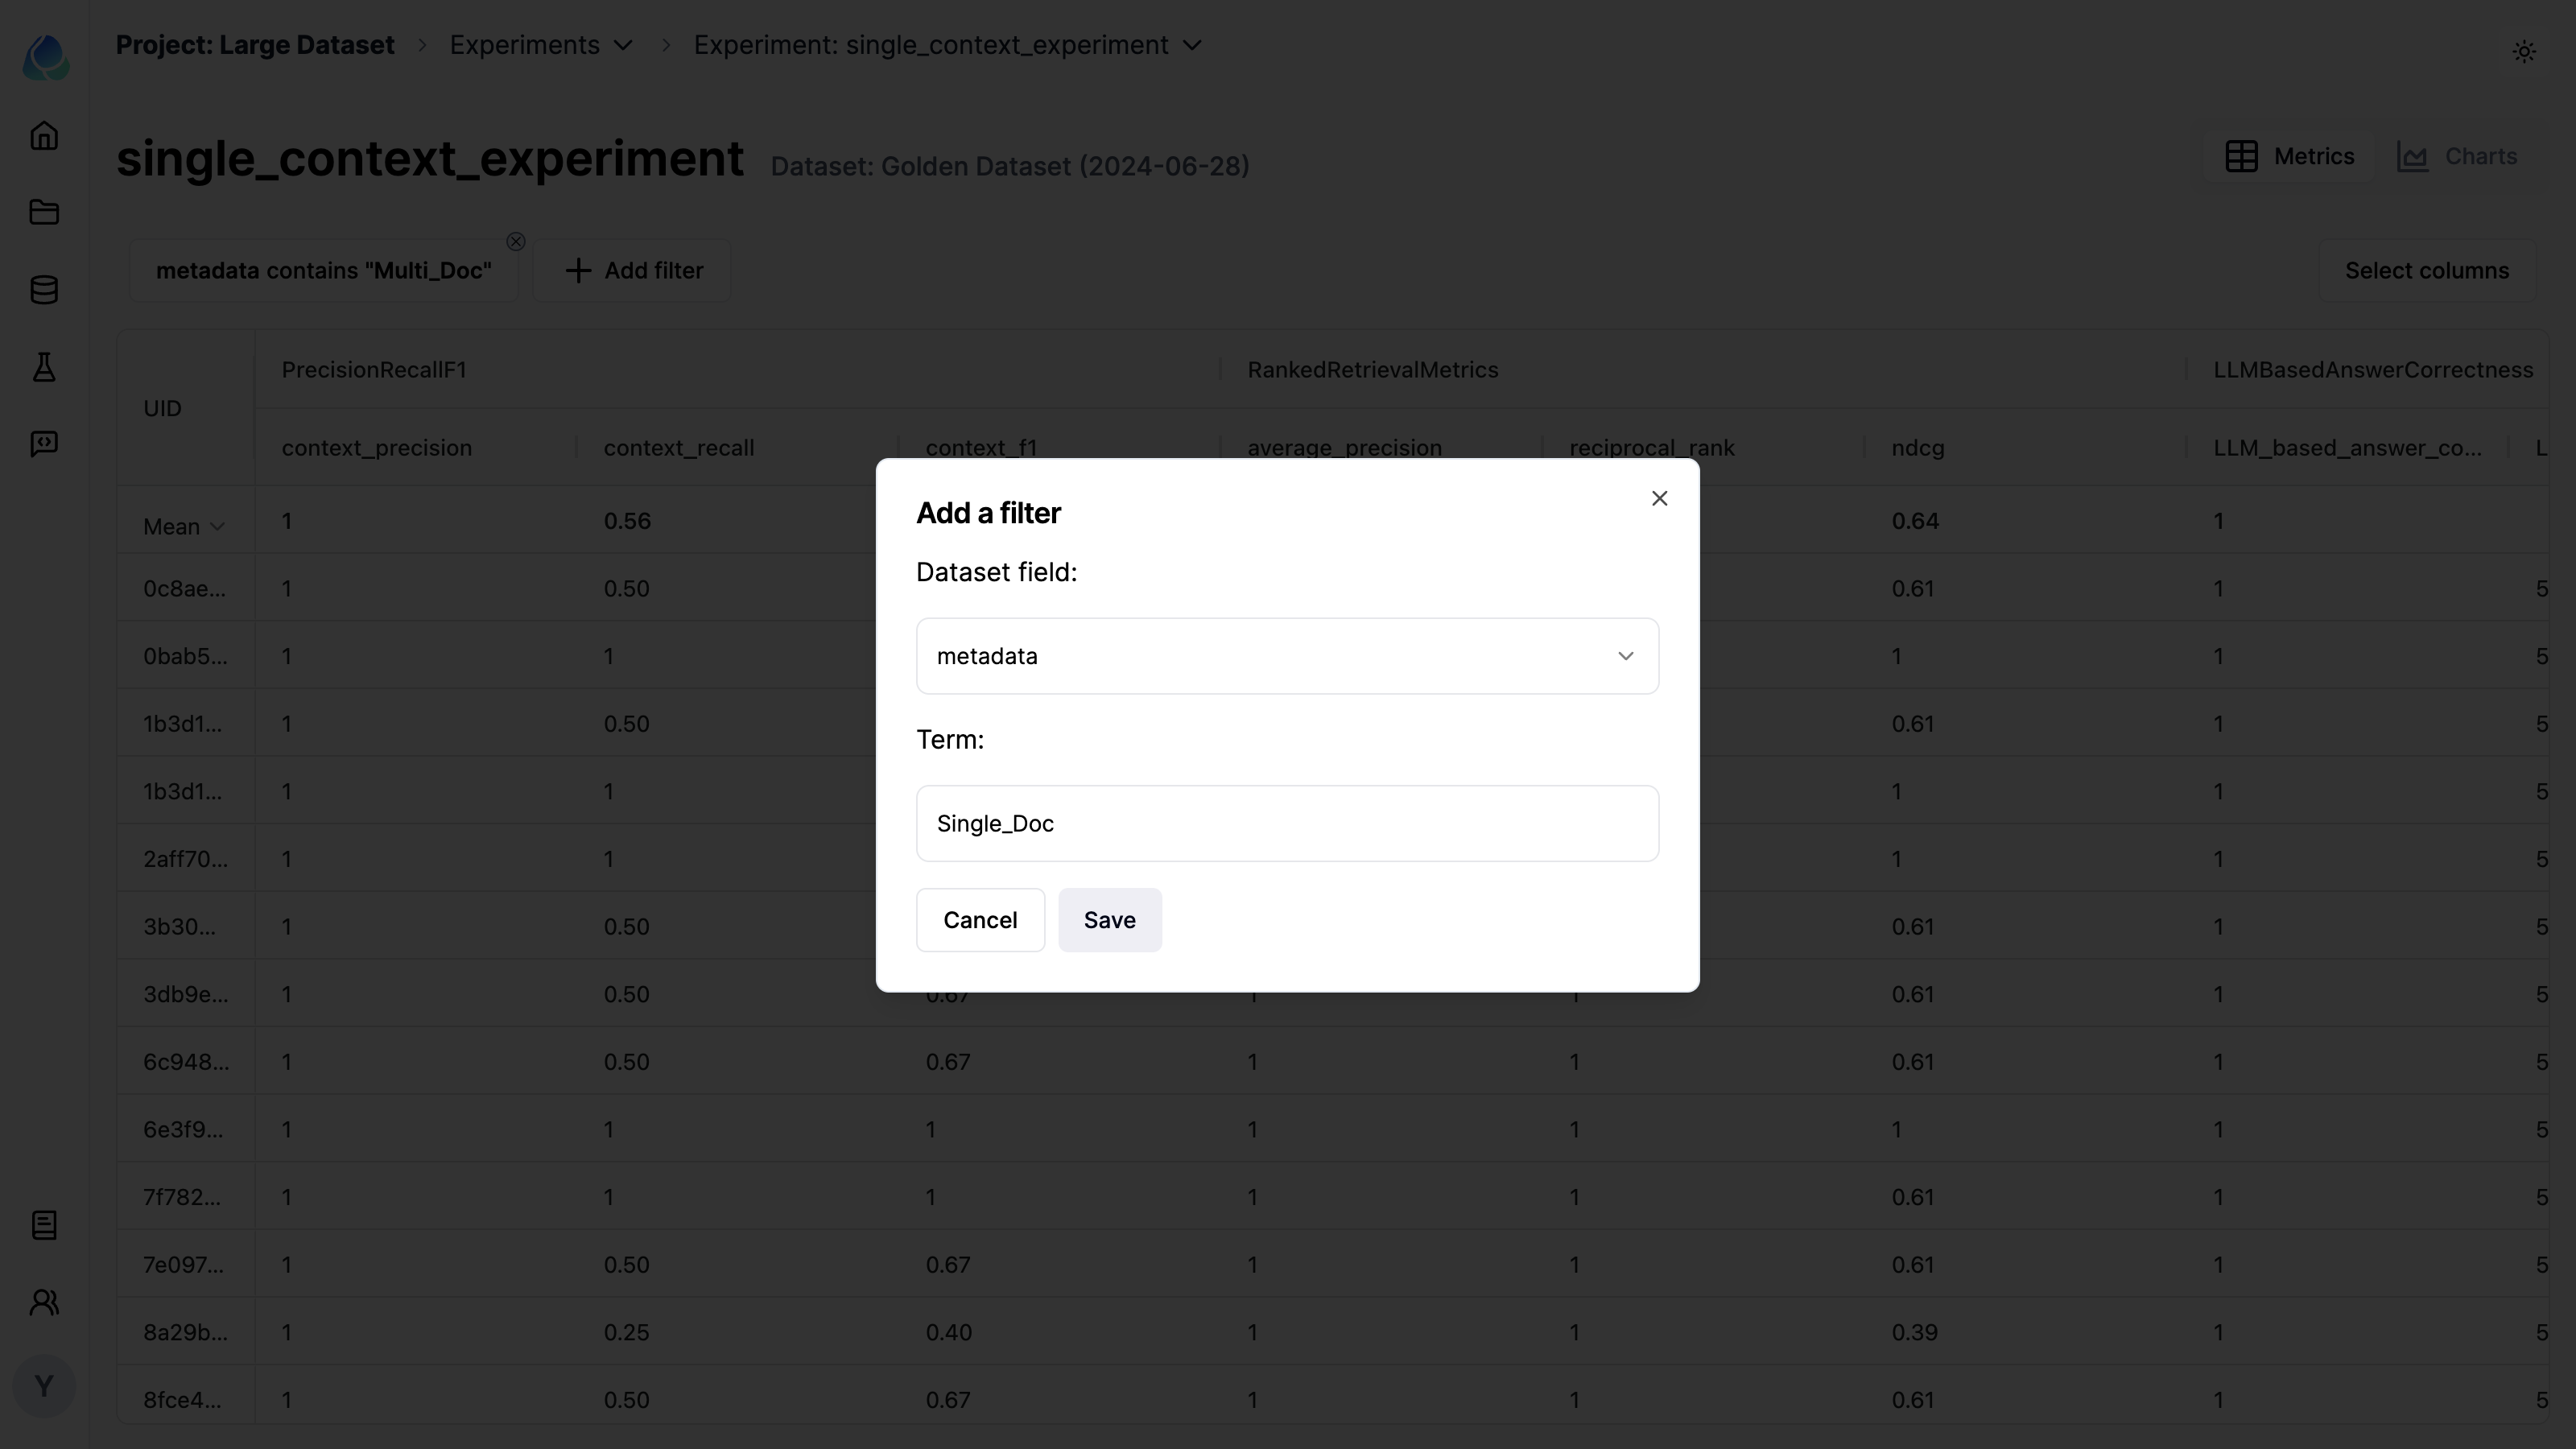
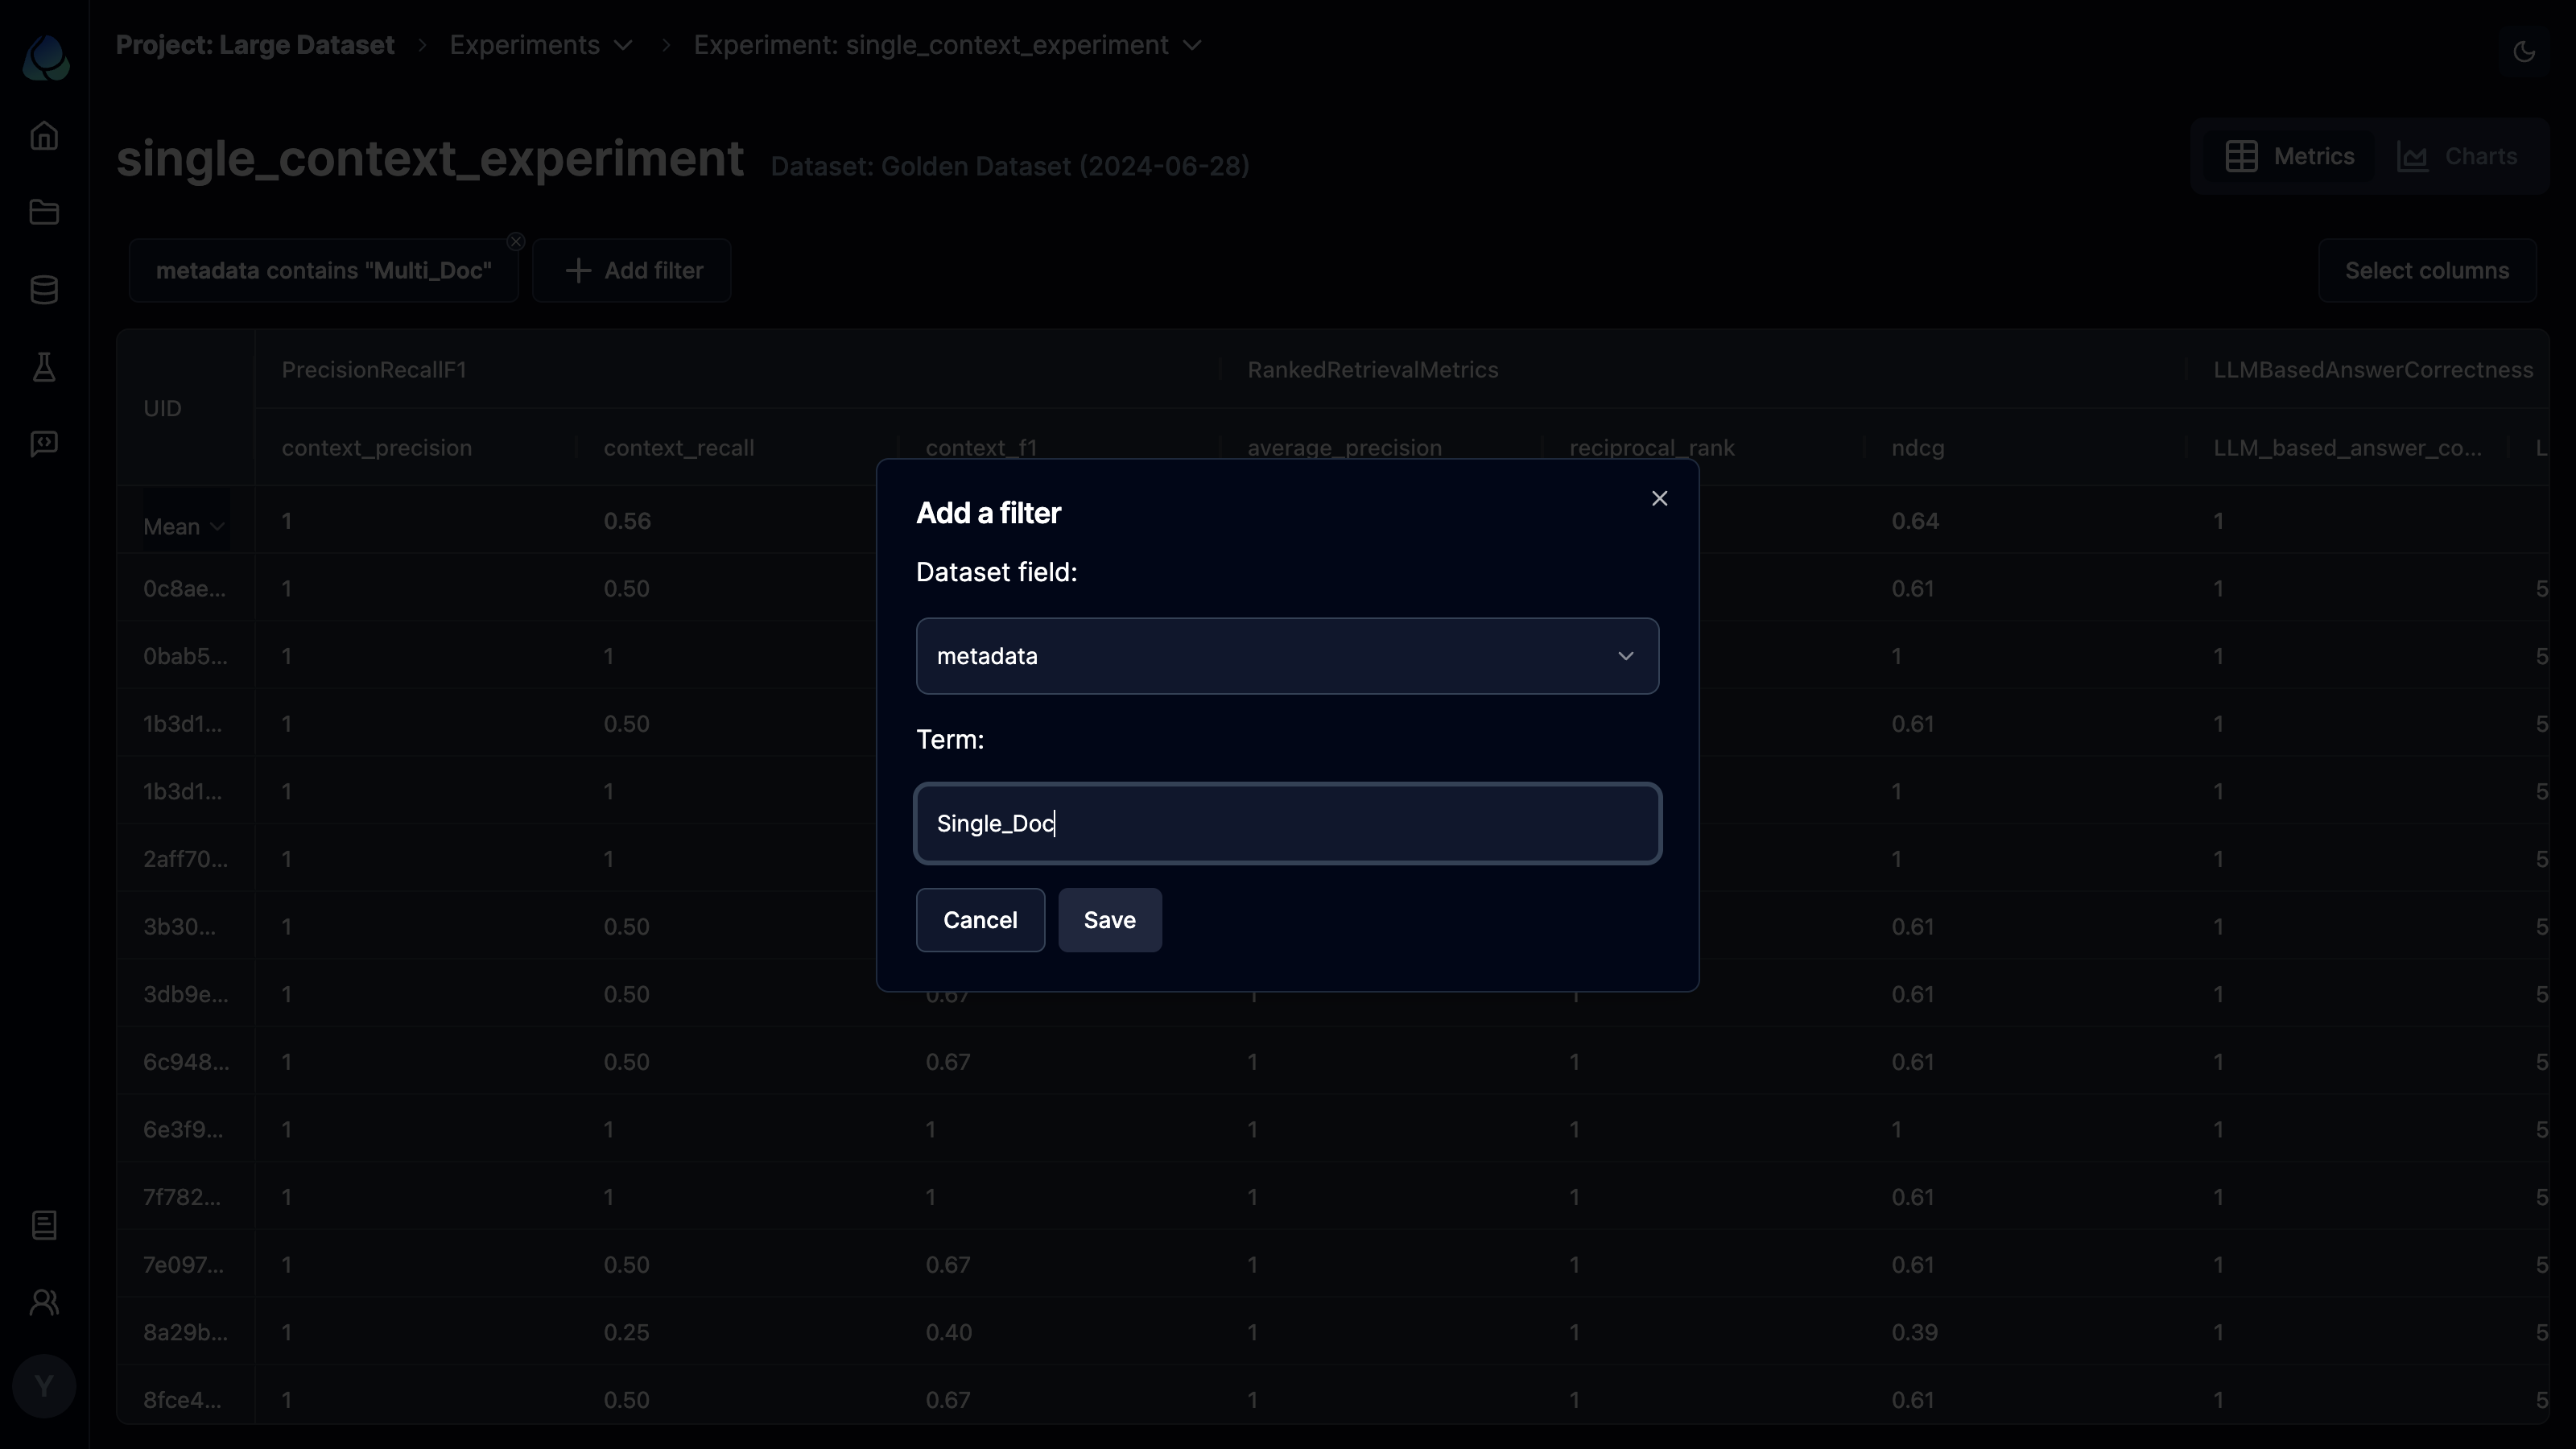
As you apply filters, the aggregate results will dynamically update to reflect the changes.
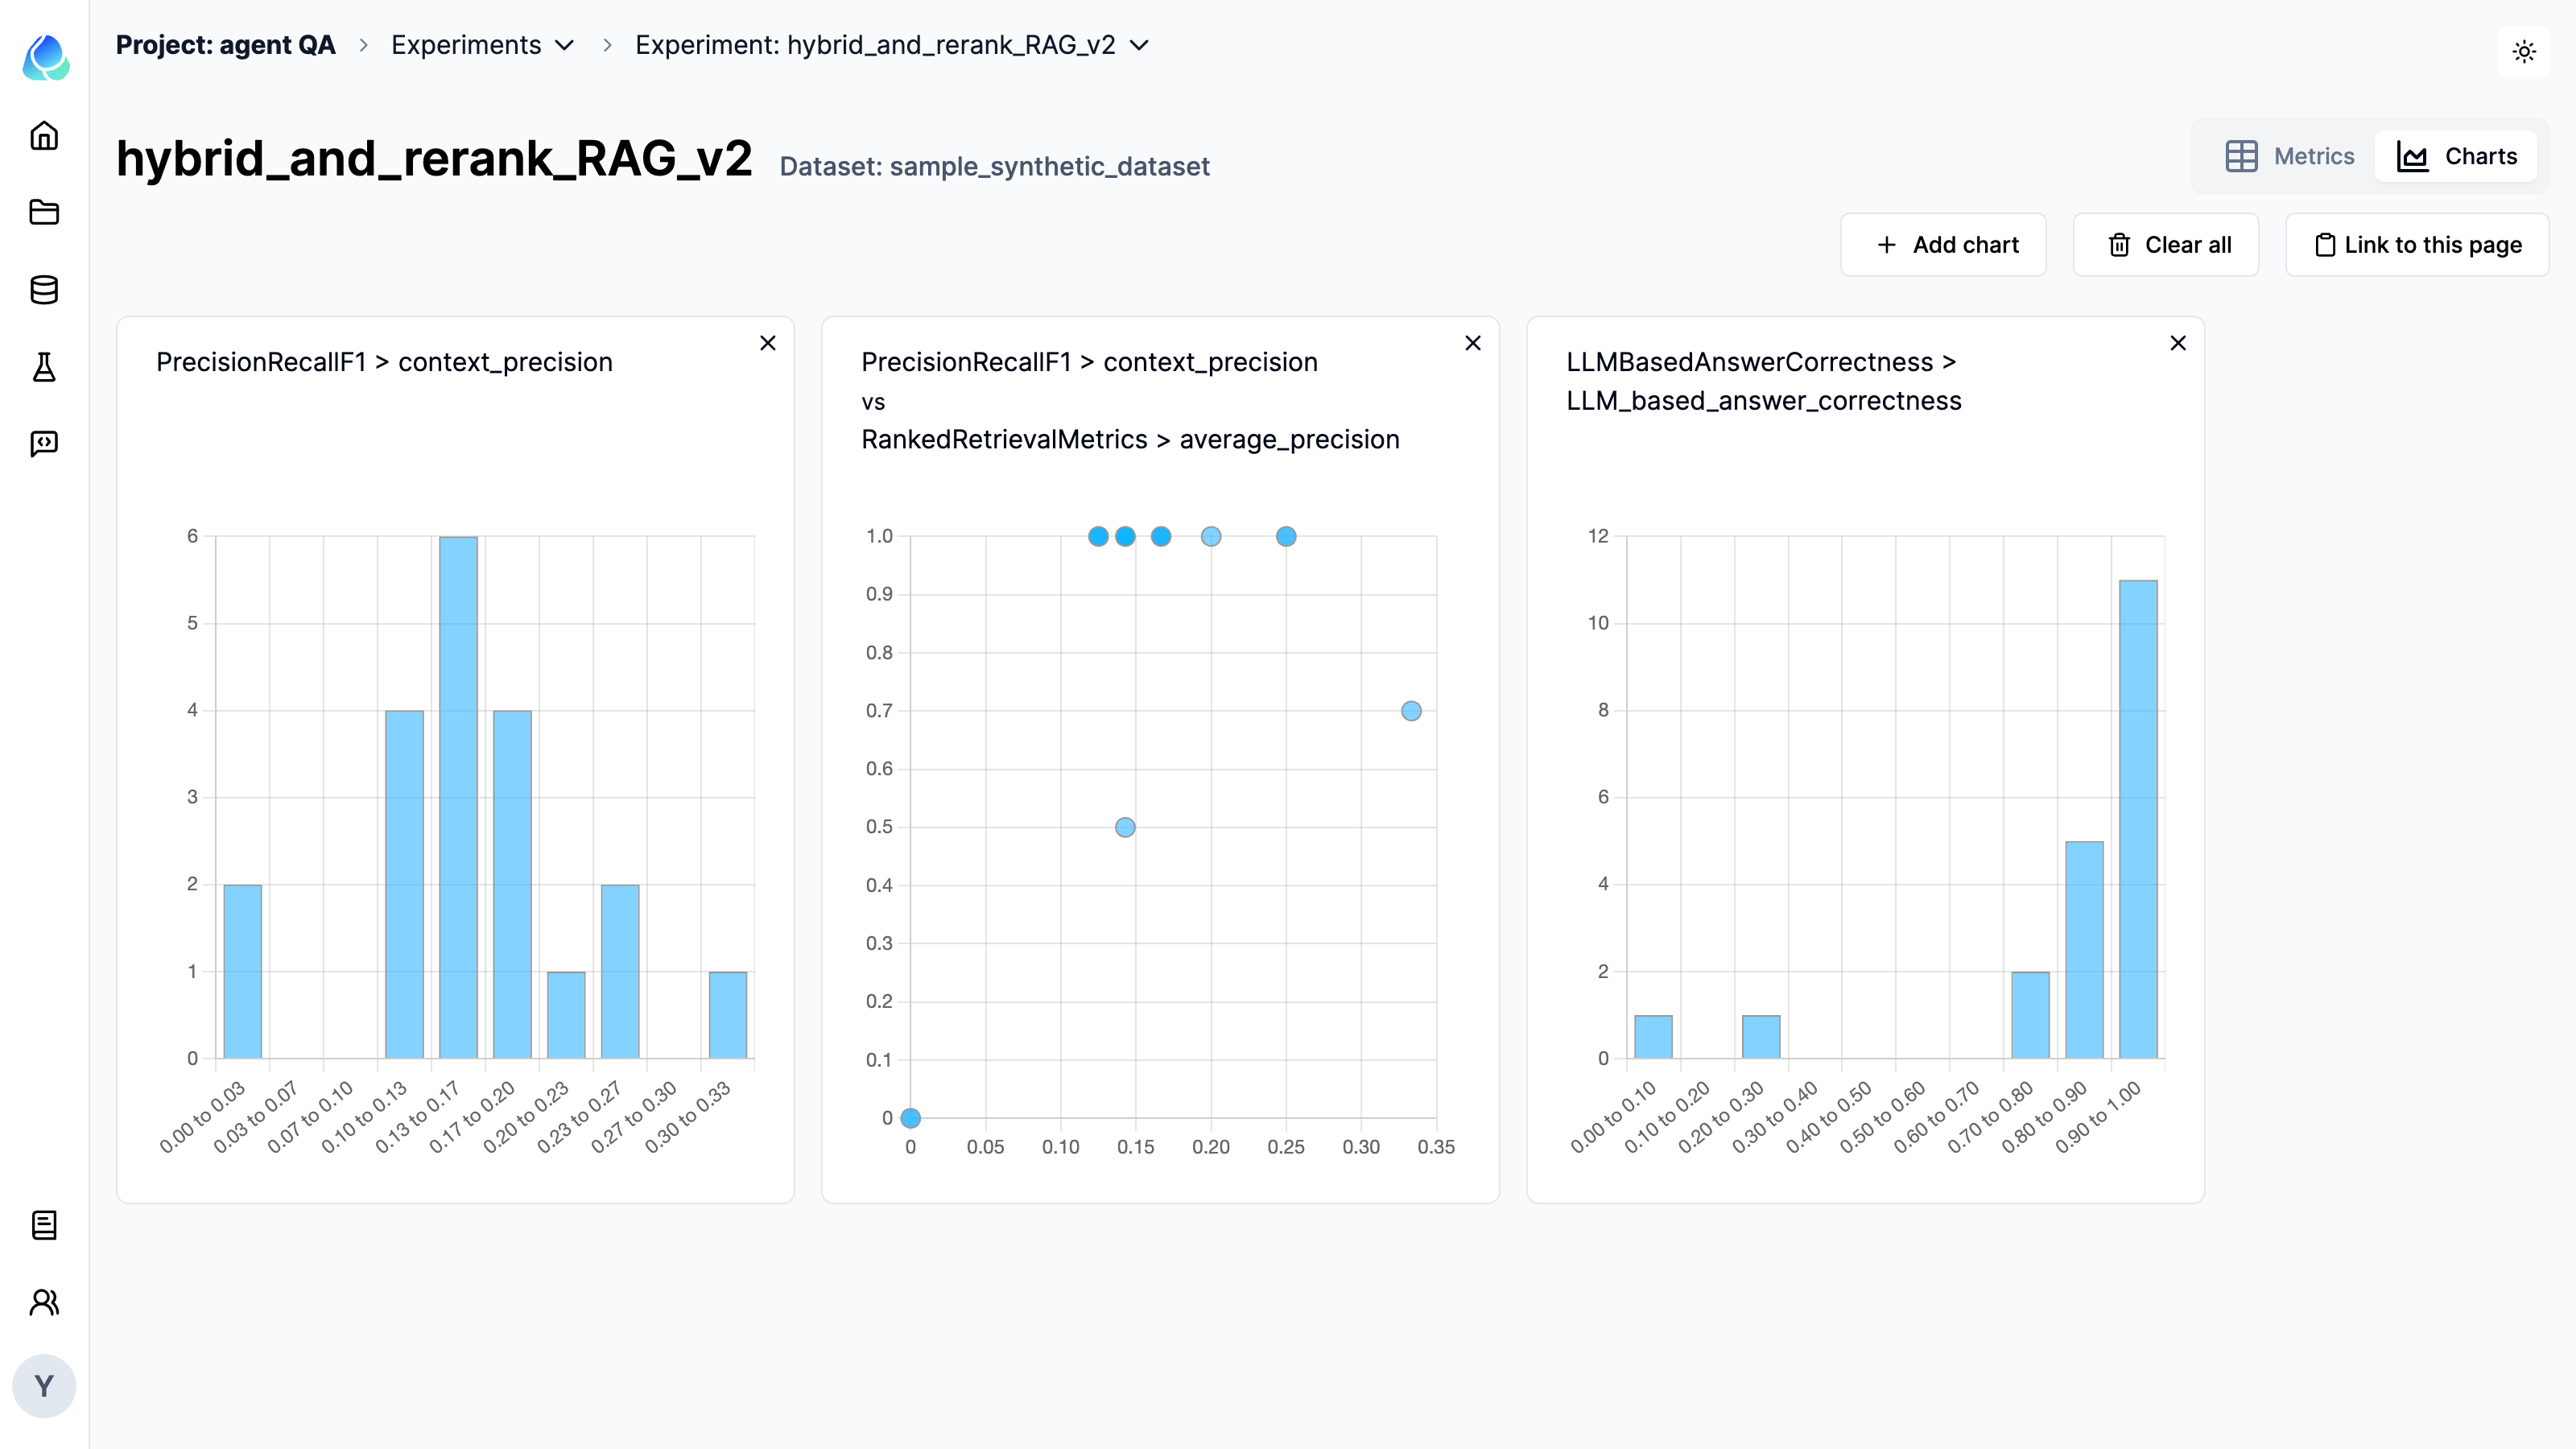
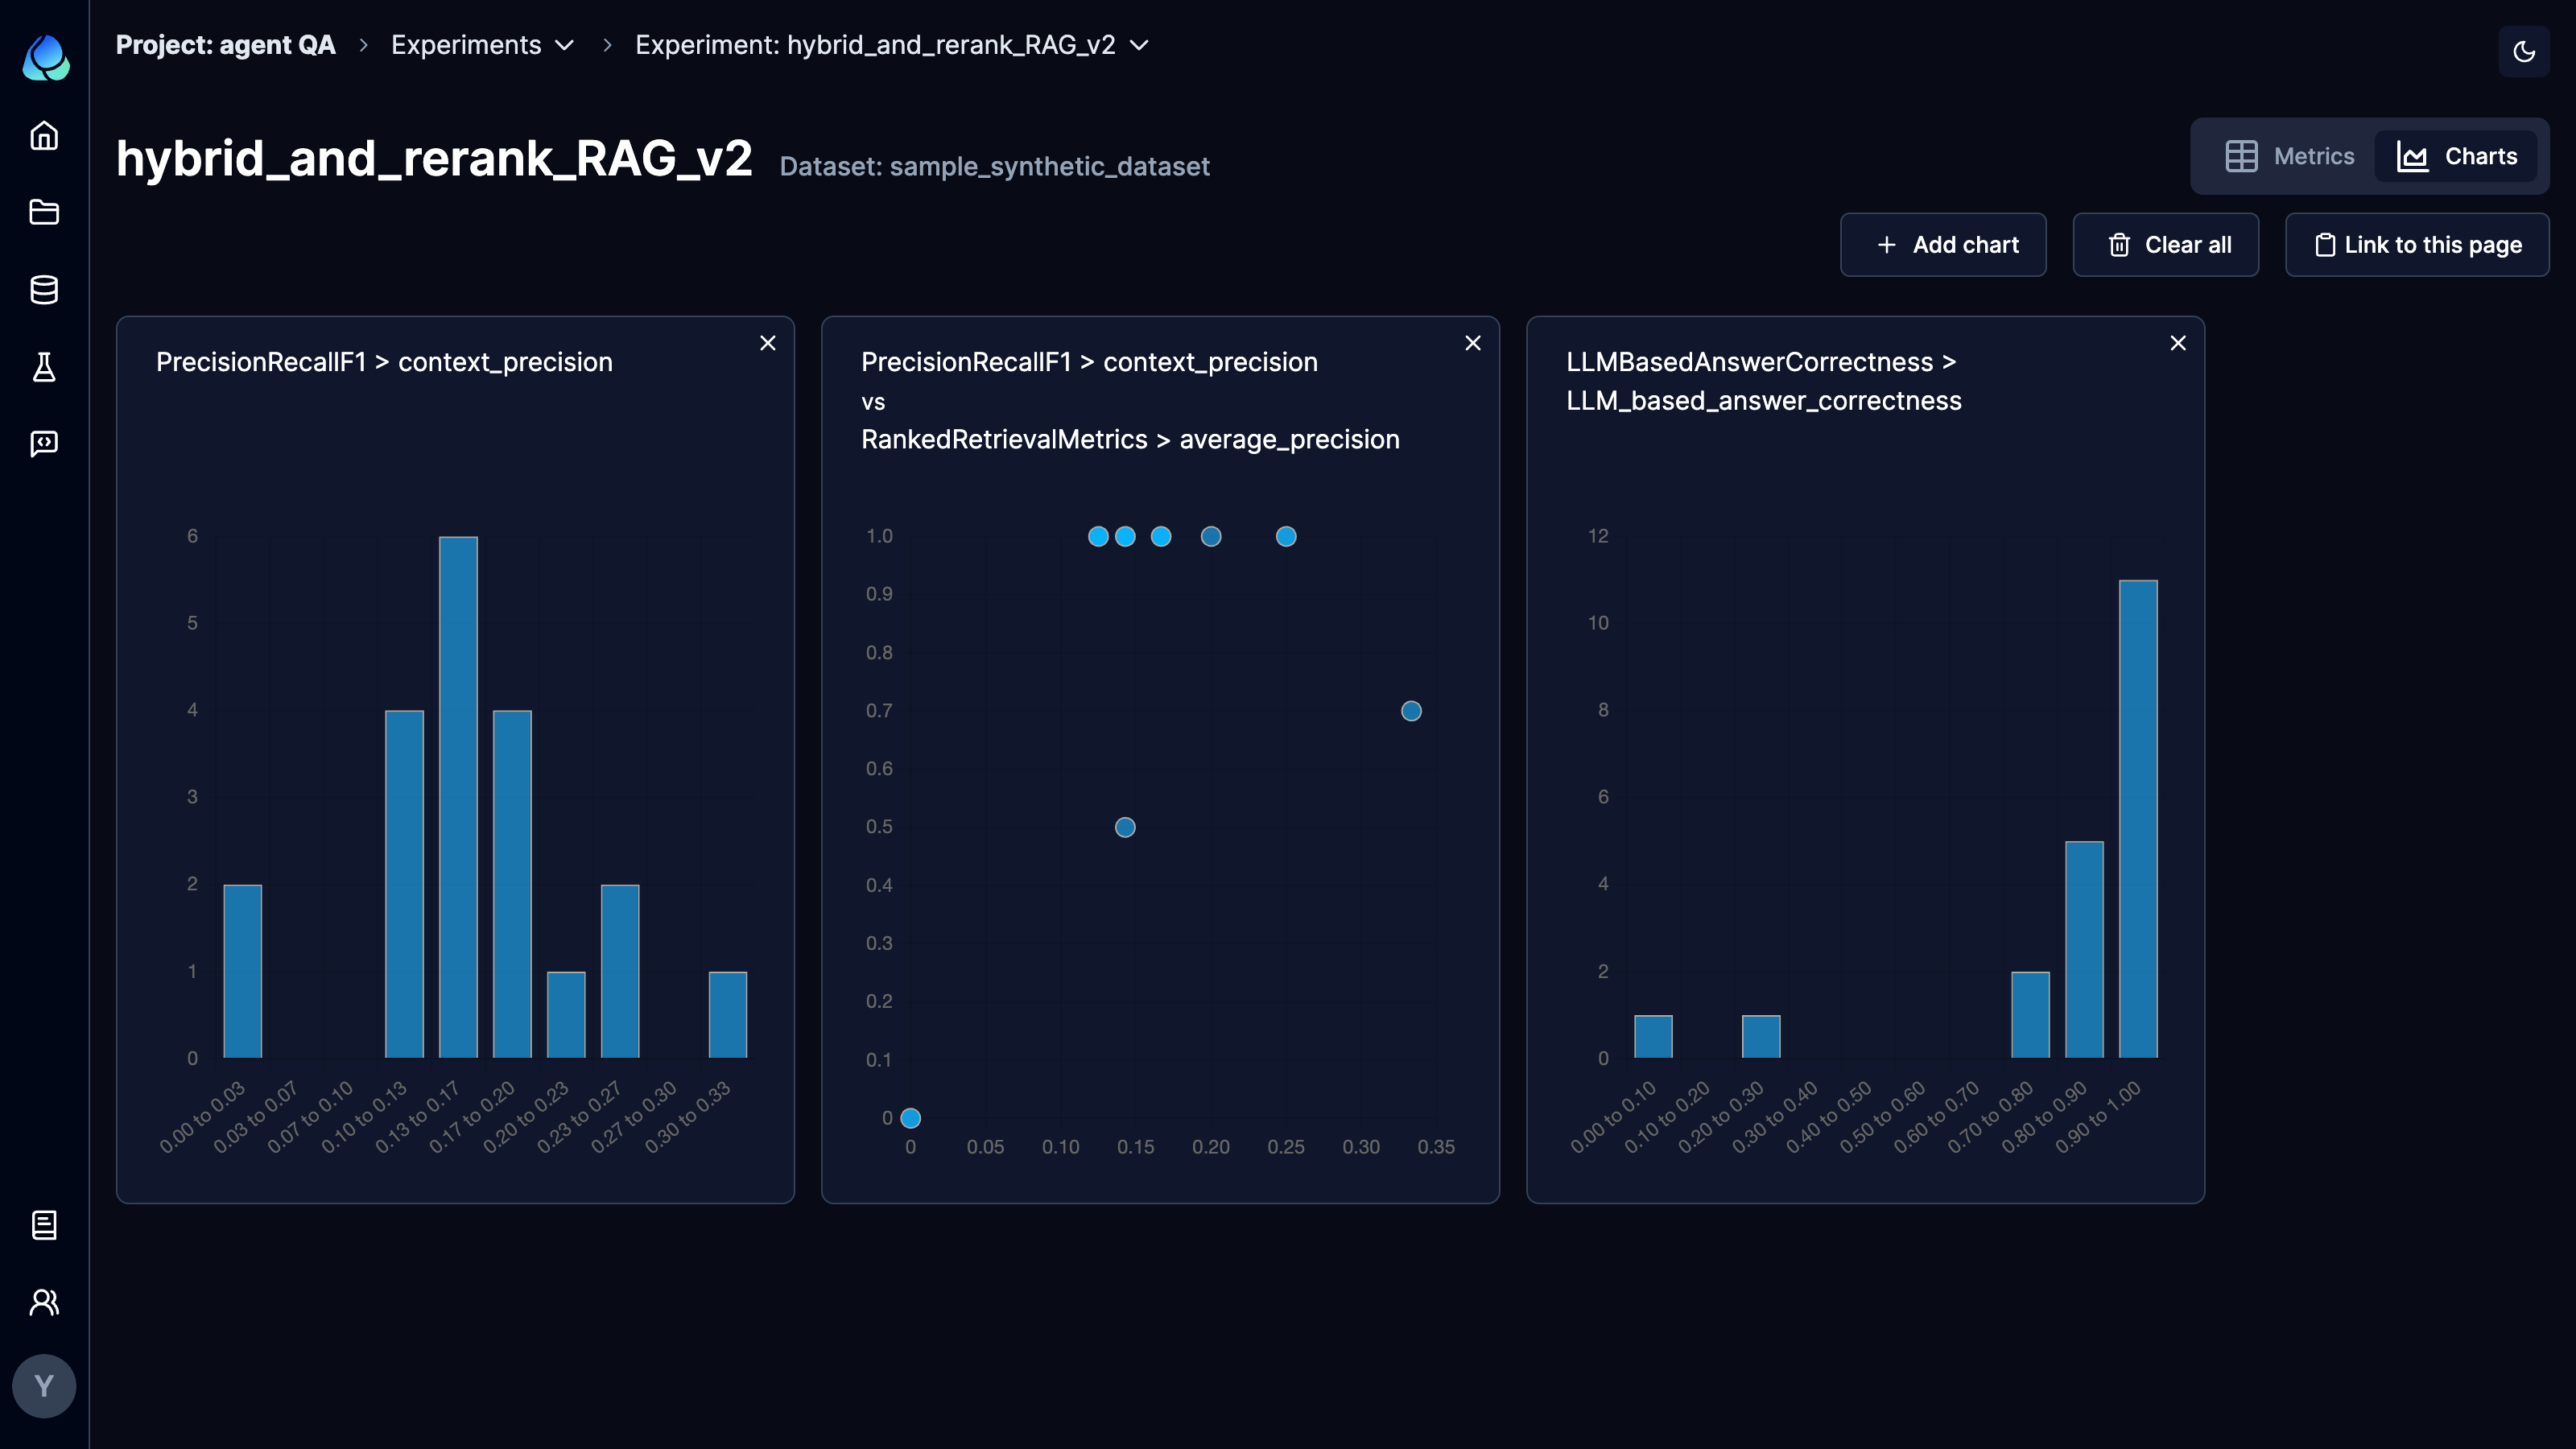
Distribution Analysis
Analyzing the distribution of your experiments can provide insights into patterns and trends. You can plot bar charts to visualize the distribution of a single metric or scatter plots to compare two metrics.